Candlestick Series View
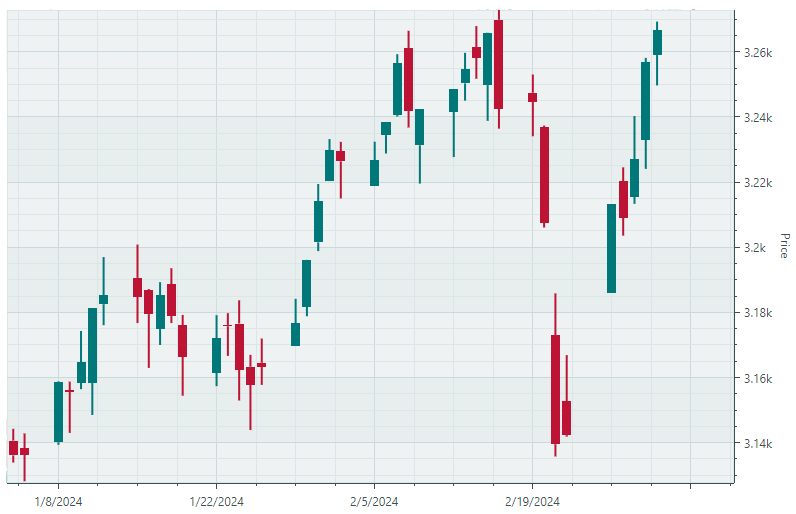
Use the Candlestick Series View (CartesianCandlestickSeriesView) in a CartesianChart control to create a financial chart that shows an asset's price movement. Data points display the High, Low, Open, and Close prices of a security for a specific period.

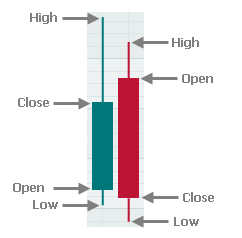
Each data point is rendered as a candlestick (or candle) which consists of a solid bar and two whiskers that can extend beyond the solid bar. The top and bottom values of the solid bar determine the Open and Close prices, while the whiskers specify the High and Low prices.

Two colors are used to paint candles. If the Close price is higher than the Open price, the candle is painted in one color. Otherwise, the candle is painted in another color. For instance, in the image above the upward candle is painted in green, and the downward candle is painted in red. With the Candlestick Series View you can specify custom colors for upward and downward candles.
The following code snippet from the "Candlestick" chart demo creates a cartesian chart that displays a Candlestick Series View.
<mxc:CartesianChart>
    <mxc:CartesianSeries AxisYKey="Price" DataAdapter="{Binding StockData}" SeriesName="Price">
        <mxc:CartesianCandlestickSeriesView Color="#00787A" ReductionColor="#BD1436" />
    </mxc:CartesianSeries>
</mxc:CartesianChart>
public partial class CartesianCandlestickSeriesViewViewModel : ChartsPageViewModel
{
    [ObservableProperty] CandlestickDataAdapter stockData;
    //...
}
Data for the Candlestick Series View
Data for any Cartersian Series View is provided using a data adapter assigned to the CartesianSeries.DataAdapter property. A data adapter supplies the X and Y values for the chart.
Two data adapters are available for the Candlestick Series View:
CandlestickDataAdapterSummaryCandlestickDataAdapter
The X values are of the DateTime type in both data adapters. Choose one of these data adapters according to the type of Y values you have.
CandlestickDataAdapter
When you use a CandlestickDataAdapter object, you supply four Y values of the Double type that specify the Open, Close, High and Low prices for each X argument. You can use the CandlestickDataAdapter constructor to populate the adapter with data.
The following code from the "Candlestick" chart demo demonstrates a CandlestickDataAdapter object initialization.
[ObservableProperty] CandlestickDataAdapter stockData;

public CartesianCandlestickSeriesViewViewModel()
{
    var data = CsvSources.Stock;
    var arguments = new List<DateTime>(data.Count);
    var open = new List<double>(data.Count);
    var high = new List<double>(data.Count);
    var low = new List<double>(data.Count);
    var close = new List<double>(data.Count);
    for (var i = data.Count - 1; i >= 0; i--)
    {
        arguments.Add(data[i].Date);
        open.Add(data[i].Open);
        high.Add(data[i].High);
        low.Add(data[i].Low);
        close.Add(data[i].Close);
    }
    StockData = new CandlestickDataAdapter(arguments, open, high, low, close);
}
The CandlestickDataAdapter object requires that you set the time unit (axis unit) for the X axis using the DateTimeScaleOptions.MeasureUnit property.
In the code snippet below, the axis unit is set to Day.
<mxc:CartesianChart.AxesX>
    <mxc:AxisX ShowTitle="False">
        <mxc:AxisXRange MinSideMargin="0.01" MaxSideMargin="0.01" VisualMax="" />
        <mxc:AxisX.ScaleOptions>
            <mxc:DateTimeScaleOptions MeasureUnit="Day" />
        </mxc:AxisX.ScaleOptions>
    </mxc:AxisX>
</mxc:CartesianChart.AxesX>
The X arguments should be supplied to the CandlestickDataAdapter data adapter according to this axis unit. For instance, when the axis unit is set to Day, the X values should specify individual days.
SummaryCandlestickDataAdapter
The SummaryCandlestickDataAdapter adapter summarizes the data you provide, and automatically calculates the Open, Close, High and Low prices per specified time frame (time unit) (for instance, per second, minute, hour, day, week, etc., or multiples of a time frame). For instance, you can supply data at one-second interval, and allow the SummaryCandlestickDataAdapter to automatically summarize this data in, say, 5-second, minute or hour intervals.
The X values specify distinct date-time values. For each X value, provide a single Y value of the Double type.
To specify an aggregation time frame, use two properties:
SummaryCandlestickDataAdapter.MeasureUnit— Specifies the base aggregation time frame (Millisecond, Second, Minute, Hour, Day, Week, Month, Quarter, or Year) for which the data adapter calculates the Open, Close, High and Low prices.SummaryCandlestickDataAdapter.MeasureUnitFactor(an integer value; default is1) — Specifies a multiplier for the base time frame to calculate the actual time frame. The actual length of the time frame is calculated by the expression:MeasureUnit x MeasureUnitFactor.
The following example sets the time frame to "2 seconds":
[ObservableProperty]
SummaryFinancialDataAdapter dataAdapter;

public CartesianSummaryCandlestickViewModel()
{
    int dataCount = 100;
    var xArgs = new List<DateTime>(dataCount);
    var yArgs = new List<double>(dataCount);
    //Populate the xArgs and yArgs lists
    //...
    dataAdapter = new SummaryFinancialDataAdapter(xArgs, yArgs);
    dataAdapter.MeasureUnit = DateTimeUnit.Second;
    dataAdapter.MeasureUnitFactor = 2;
}
The CandlestickDataAdapter and SummaryCandlestickDataAdapter classes expose methods to remove and add points. These methods are helpful when the chart data needs to be updated in real time.
Add— Adds a new data point at the end of the data array.UpdateValue— Modifies a data point at a specific position.RemoveFromStart— Removes the specified number of data points from the beginning.Clear— Clears all data.
Candle Color and Thickness
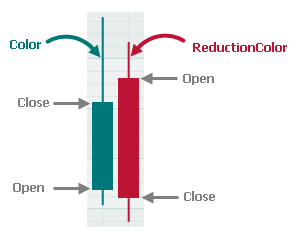
Use the Color and ReductionColor properties of the CartesianCandlestickSeriesView to specify candle colors:
CartesianCandlestickSeriesView.Color— Specifies the color to paint candles whose Close price is higher than or equal to the Open price.CartesianCandlestickSeriesView.ReductionColor— Specifies the color to paint candles whose Close price is lower than the Open price.

The following properties allow you to customize thickness of candles:
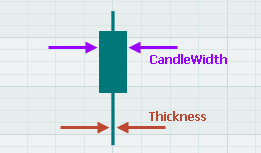
CandleWidth— A Double value that specifies the thickness of a candle's solid bar. TheCandleWidthproperty value is measured in axis units. The Candlestick series view uses a date-time axis. Its axis unit is determined by theDateTimeScaleOptions.MeasureUnitproperty. For instance, if theMeasureUnitproperty is set toDay, the axis unit is set to the distance between two adjacent days along the date-time axis. When theCandleWidthproperty is set to0.5, the candle width is set to half the distance between two adjacent days.Thickness— A Double value that specifies the thickness of a candle's whiskers. This property's value is measured in pixels.

Axes
As with other series views, you can customize axes for the Candlestick chart type using the CartesianChart.AxesX and CartesianChart.AxesY properties. The X axis of the Candlestick chart displays date-time values. To customize the scale settings of the X axis, set the AxisX.ScaleOptions property to a DateTimeScaleOptions object.
The following code snippet creates a CartesianChart control with a Candlestick series view, and customizes the chart's axes. See the "Candlestick" chart demo for the complete example.
<mxc:CartesianChart Grid.Row="1" Classes="DemoChart" x:Name="DemoControl">
    <mxc:CartesianSeries DataAdapter="{Binding StockData}">
        <mxc:CartesianCandlestickSeriesView Color="#00787A" ReductionColor="#BD1436" />
    </mxc:CartesianSeries>

    <mxc:CartesianChart.AxesX>
        <mxc:AxisX ShowTitle="False">
            <mxc:AxisXRange MinSideMargin="0.01" MaxSideMargin="0.01" VisualMax="" />
            <mxc:AxisX.ScaleOptions>
                <mxc:DateTimeScaleOptions MeasureUnit="Day" />
            </mxc:AxisX.ScaleOptions>
        </mxc:AxisX>
    </mxc:CartesianChart.AxesX>

    <mxc:CartesianChart.AxesY>
        <mxc:AxisY Title="Price" Position="Far" Key="Price">
            <mxc:AxisYRange AlwaysShowZeroLevel="False" />
        </mxc:AxisY>
    </mxc:CartesianChart.AxesY>
</mxc:CartesianChart>
Refer to the following topic for more information on customization of the axis range, scale settings and labels: Cartesian Chart - Axes.