Point Series View
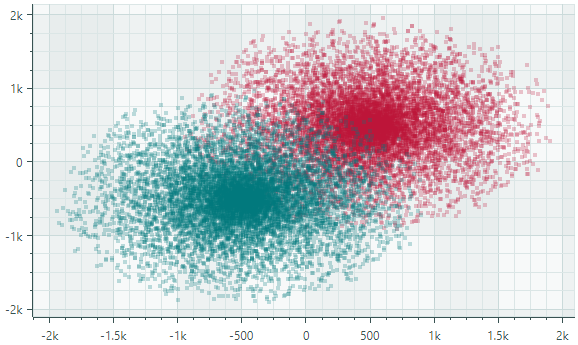
The Point Series View (CartesianPointSeriesView) plots individual points. Each point is addressed by X and Y values. The following image shows a sample CartesianPointSeriesView that displays two series of scattered points, each painted in its own color.
Create a Point Series View
To create a Point Series View, add a CartesianSeries object to the CartesianChart.Series collection, and initialize the CartesianSeries.View with a CartesianPointSeriesView instance.
The following code shows how to create a Point Area Series View in XAML and code-behind.
<mxc:CartesianChart x:Name="chartControl">
    <mxc:CartesianChart.Series>
        <mxc:CartesianSeries Name="pointSeries1" DataAdapter="{Binding DataAdapter}" >
            <mxc:CartesianPointSeriesView Color="Red" MarkerSize="2"/>
        </mxc:CartesianSeries>
    </mxc:CartesianChart.Series>
</mxc:CartesianChart>
CartesianSeries series = new CartesianSeries();
chartControl.Series.Add(series);
double[] args = new double[] {3,2,1,2,3,4,5,4 };
double[] values = new double[] { -1,0,1,2,3,2,1,0 };
// Use ScatterDataAdapter since points are not sorted by the X coordinate
series.DataAdapter = new ScatterDataAdapter(args, values);
series.View = new CartesianPointSeriesView()
{
    Color = Avalonia.Media.Colors.Blue,
    MarkerSize = 4,
};
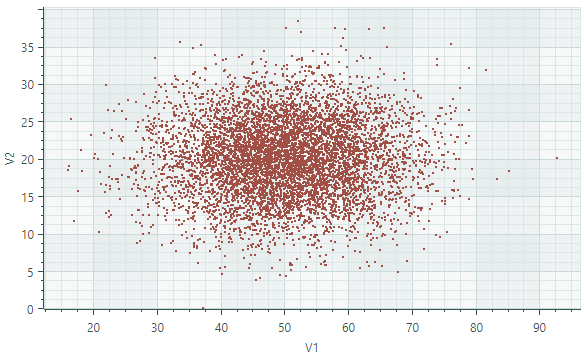
Example - Use a Point Series View to Display a Cluster of Points
In this example, the Point Series View is used to display points randomly scattered along the numeric X and Y axes. Points in the source data series are not sorted by the X coordinate. To provide unsorted points to the Series View, the ScatterDataAdapter adapter is used.
<mx:MxWindow xmlns="https://github.com/avaloniaui"
        xmlns:x="http://schemas.microsoft.com/winfx/2006/xaml"
        xmlns:vm="using:ChartPointSeriesView.ViewModels"
        xmlns:d="http://schemas.microsoft.com/expression/blend/2008"
        xmlns:mc="http://schemas.openxmlformats.org/markup-compatibility/2006"
        xmlns:mx="https://schemas.eremexcontrols.net/avalonia"
        xmlns:mxc="https://schemas.eremexcontrols.net/avalonia/charts"
        mc:Ignorable="d" d:DesignWidth="800" d:DesignHeight="450"
        x:Class="ChartPointSeriesView.Views.MainWindow"
        x:DataType="vm:MainWindowViewModel"
        Icon="/Assets/EMXControls.ico"
        Title="ChartPointSeriesView"
        Width="600" Height="400">

    <Design.DataContext>
        <vm:MainWindowViewModel/>
    </Design.DataContext>

    <mxc:CartesianChart x:Name="chartControl">
        <mxc:CartesianChart.Series>
            <mxc:CartesianSeries Name="pointSeries1" DataAdapter="{Binding PointSeriesVM1.DataAdapter}" >
                <mxc:CartesianPointSeriesView Color="{Binding PointSeriesVM1.Color}" MarkerSize="2"/>
            </mxc:CartesianSeries>
        </mxc:CartesianChart.Series>
        <mxc:CartesianChart.AxesX>
            <mxc:AxisX Name="xAxis" Title="V1" />
        </mxc:CartesianChart.AxesX>
        <mxc:CartesianChart.AxesY>
            <mxc:AxisY Title="V2"/>
        </mxc:CartesianChart.AxesY>
    </mxc:CartesianChart>
</mx:MxWindow>
using CommunityToolkit.Mvvm.ComponentModel;
using Eremex.AvaloniaUI.Charts;
using System.Collections.Generic;
using System;
using Avalonia.Media;
using Avalonia;

namespace ChartPointSeriesView.ViewModels;

public partial class MainWindowViewModel : ViewModelBase
{
    [ObservableProperty] SeriesViewModel pointSeriesVM1;

    public MainWindowViewModel()
    {
        PointSeriesVM1 = new()
        {
            Color = Color.FromUInt32(0xffa24f46),
            DataAdapter = GenerateRandomData()
        };
    }

    private static Random random = new Random();
    private static double GenerateNormalValue(double mean, double stdDev)
    {
        double u1 = 1.0 - random.NextDouble();
        double u2 = 1.0 - random.NextDouble();
        double randStdNormal = Math.Sqrt(-2.0 * Math.Log(u1)) * Math.Sin(2.0 * Math.PI * u2);
        return mean + stdDev * randStdNormal;
    }

    public static ScatterDataAdapter GenerateRandomData()
    {
        int count = 7000;
        double xMean= 50, xStdDev= 10, yMean = 20, yStdDev = 5;
        List<double> args = new List<double>();
        List<double> values = new List<double>();
        for(int i = 0; i < count; i++)
        {
            double x = GenerateNormalValue(xMean, xStdDev);
            double y = GenerateNormalValue(yMean, yStdDev);
            args.Add(x);
            values.Add(y);
        }
        return new ScatterDataAdapter(args, values);
    }
}

public partial class SeriesViewModel : ObservableObject
{
    [ObservableProperty] Color color;
    [ObservableProperty] ScatterDataAdapter dataAdapter;
}
Data for the Point Series View
You can use the following data adapters to provide data for Point Series Views:
Numeric X Values:
FormulaDataAdapterScatterDataAdapterSortedNumericDataAdapter
Date and Time X Values:
SortedDateTimeDataAdapterSortedTimeSpanDataAdapter
Qualitative X Values:
QualitativeDataAdapter
Point Series View Settings
Color— Specifies the color used to paint the series.MarkerImage— Allows you to specify an image in SVG format to use as point markers.MarkerImageCss— Specifies the CSS code that allows you to customize colors of elements in the specified SVG image (MarkerImage).MarkerSize— Specifies the size of point markers.ShowInCrosshair— Specifies the visibility of the crosshair chart label for the current series. See Customize Chart Labels of the Crosshair.