Get Started with Charts
This tutorial shows how to display three data series within a CartesianChart control, using the Bar and Line series views.
First, we'll define data for a chart control (in View Model objects), and then bind the chart control to this data.
Next, we'll define and customize the default axes, and show how to add an additional X axis and associate it with a specific series.
Define a View Model for a Series
Start by creating a View Model for a single series.
using Eremex.AvaloniaUI.Charts;

public partial class SeriesViewModel : ObservableObject
{
    [ObservableProperty] Color color;
    [ObservableProperty] ISeriesDataAdapter dataAdapter;
}
The SeriesViewModel class exposes two properties that specify the color and data for a series.
Data for a chart control's series is supplied using Data Adapter objects. Eremex Charts support multiple Data Adapters for various data types (numeric, date-time, and qualitative). In this tutorial, we'll use two Data Adapters:
SortedNumericDataAdapter— Supplies (numeric X, numeric Y) pairs sorted by the X values.SortedDateTimeDataAdapter— Supplies (DateTime X, numeric Y) pairs sorted by the X values.
These Data Adapters are initialized in the main View Model.
For information on other Data Adapters, see Cartesian Chart.
Define the Main View Model
Create the MainWindowViewModel class which encapsulates the main View Model for the Window. A MainWindowViewModel instance will be set as the window's (and the chart control's) DataContext.
Add three SeriesViewModel properties to the MainWindowViewModel class. They describe three data series in the target chart control.
public partial class MainWindowViewModel : ViewModelBase
{
    [ObservableProperty] SeriesViewModel barSeries1;
    [ObservableProperty] SeriesViewModel barSeries2;
    [ObservableProperty] SeriesViewModel lineSeries;
}
Initialize these objects in the View Model's constructor, and specify the colors and Data Adapters for the series.
public partial class MainWindowViewModel : ViewModelBase
{
    public MainWindowViewModel()
    {
        //Init data
        var random = new Random(4);
        var random2 = new Random(0);

        var startDate = new DateTime(DateTime.Now.Year, 1, 1);
        SortedDateTimeDataAdapter barSeries1DataAdapter = new();
        SortedDateTimeDataAdapter barSeries2DataAdapter = new();
        SortedNumericDataAdapter lineSeriesDataAdapter = new();
        for (int i = 0; i < 12; i++)
        {
            var argument = startDate.AddMonths(i);
            barSeries1DataAdapter.Add(argument, random.NextDouble() * 100 - 30);
            barSeries2DataAdapter.Add(argument, random.NextDouble() * 100 - 30);
        }
        double startValue = 20;
        for (int i = 0; i < 365; i++)
        {
            var argument = i;
            var value = startValue + (random2.NextDouble() - 0.5) * 10;
            lineSeriesDataAdapter.Add(argument, value);
            startValue = value;
        }
        // Create data series
        BarSeries1 = new() { Color = Color.FromArgb(255, 0, 120, 122), DataAdapter = barSeries1DataAdapter };
        BarSeries2 = new() { Color = Color.FromArgb(255, 0, 170, 110), DataAdapter = barSeries2DataAdapter };
        LineSeries = new() { Color = Color.FromArgb(255, 120, 10, 12), DataAdapter = lineSeriesDataAdapter };
    }

    [ObservableProperty] SeriesViewModel barSeries1;
    [ObservableProperty] SeriesViewModel barSeries2;
    [ObservableProperty] SeriesViewModel lineSeries;
}
Data Adapters are populated with random data:
The
SortedDateTimeDataAdapterobjects are filled with 12 points that correspond to 12 months of the year. The X values of theSortedDateTimeDataAdapterobjects areDateTimevalues.The
SortedNumericDataAdapterobject is populated with 365 points that correspond to the days of the year. The X values of theSortedNumericDataAdapterobject are numeric values.
Create a Cartesian Chart Control
Ensure that the DataContext of the window and the chart control is set to a MainWindowViewModel object.
Open the MainWindow XAML file, and define a CartersianChart control with two series as follows:
xmlns:mxc="https://schemas.eremexcontrols.net/avalonia/charts"

<mxc:CartesianChart>
    <mxc:CartesianChart.Series>
        <mxc:CartesianSeries Name="barSeries1" DataAdapter="{Binding BarSeries1.DataAdapter}" >
        </mxc:CartesianSeries>

        <mxc:CartesianSeries Name="barSeries2" DataAdapter="{Binding BarSeries2.DataAdapter}" >
        </mxc:CartesianSeries>
    </mxc:CartesianChart.Series>
</mxc:CartesianChart>
This code adds two series (CartesianSeries objects) to the CartesianChart.Series collection, and binds them to corresponding data adapters in the main View Model.
Specify a Series View
A series view determines the visual appearance and settings of the series. The Cartesian Chart supports multiple series views: Line, Scatter Line, Range Area, Bar, Range Bar, etc. See the following topic for more information: Cartesian Chart.
Let's apply the Bar series view to the series. For this purpose, define a CartesianSideBySideBarSeriesView object as a CartesianSeries object's content.
<mxc:CartesianChart>
    <mxc:CartesianChart.Series>
        <mxc:CartesianSeries Name="barSeries1" DataAdapter="{Binding BarSeries1.DataAdapter}" >
            <mxc:CartesianSideBySideBarSeriesView Color="{Binding BarSeries1.Color}" />
        </mxc:CartesianSeries>
        <mxc:CartesianSeries Name="barSeries2" DataAdapter="{Binding BarSeries2.DataAdapter}" >
            <mxc:CartesianSideBySideBarSeriesView Color="{Binding BarSeries2.Color}" />
        </mxc:CartesianSeries>
    </mxc:CartesianChart.Series>
</mxc:CartesianChart>
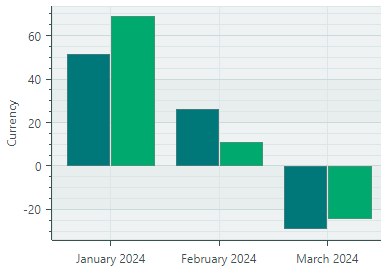
CartesianSideBySideBarSeriesView renders points as rectangular bars:
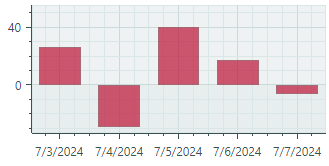
The series view's Color setting allows you to specify the color to render the associated series.
Create and Customize Default Axes
Cartesian Chart can automatically create axes for underlying data. You may need to manually define the X and Y axes if you want to customize axis settings (for instance, specify a title and scale options).
To define axes, add AxisX and/or AxisY objects to the CartesianChart.AxesX/CartesianChart.AxesY collections:
<mxc:CartesianChart>
    <!-- ... -->
    <mxc:CartesianChart.AxesX>
        <mxc:AxisX Name="salesAxis" Title="Sales">
            <mxc:AxisX.ScaleOptions>
                <mxc:DateTimeScaleOptions MeasureUnit="Month" />
            </mxc:AxisX.ScaleOptions>
        </mxc:AxisX>
    </mxc:CartesianChart.AxesX>

    <mxc:CartesianChart.AxesY>
        <mxc:AxisY Title="Currency"/>
    </mxc:CartesianChart.AxesY>
</mxc:CartesianChart>
The code above creates the X and Y axes, and specifies titles for them.
Since the underlying data points represent values for individual months, the Month time unit is applied to the horizontal date-time axis (using the AxisX.ScaleOptions property).
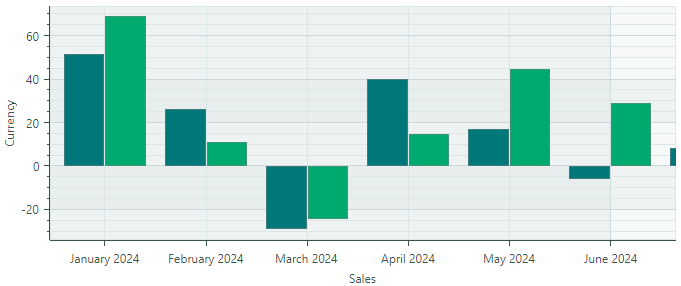
If you run the application now, you'll see the following result:
Add an Additional Series and X Axis
You can add as many series to the chart control as you want. These series can use either default or their own axes.
Let's add a Line Series and an axis for it to the chart.
First, create a new CartesianSeries object in the CartesianChart.Series collection, and bind it to the LineSeries.DataAdapter object defined in the View Model.
<mxc:CartesianChart>
    <mxc:CartesianChart.Series>
        <!-- ... -->
        <mxc:CartesianSeries Name="lineSeries" DataAdapter="{Binding LineSeries.DataAdapter}" >
        </mxc:CartesianSeries>
    </mxc:CartesianChart.Series>
</mxc:CartesianChart>
Specify a Line Series View
To apply the Line Series View to this series, define a CartesianLineSeriesView object as the series' content:
<mxc:CartesianSeries Name="lineSeries" DataAdapter="{Binding LineSeries.DataAdapter}" >
    <mxc:CartesianLineSeriesView Color="{Binding LineSeries.Color}" />
</mxc:CartesianSeries>
CartesianLineSeriesView is a series view that connects points with lines:
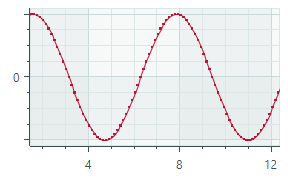
As with any series view, you can use the CartesianLineSeriesView.Color property to specify the paint color of the series.
Specify its Own Axis for the Line Series
The X values of the Line series are of the numeric type, while the existing horizontal axis displays DateTime values. Thus, an additional numeric axis is required for the Line series.
Define a new numeric X axis in the CartesianChart.AxesX collection.
<mxc:CartesianChart.AxesX>
    <!-- ... -->
    <mxc:AxisX Position="Far" Title="Expenses">
        <mxc:AxisX.ScaleOptions>
            <mxc:NumericScaleOptions />
        </mxc:AxisX.ScaleOptions>
    </mxc:AxisX>
</mxc:CartesianChart.AxesX>
The axis's Position property is set to Far to display the axis at the edge opposite to the default position. For a horizontal axis, the Far option corresponds to the chart's top edge. For a vertical axis, the Far option places the axis at the chart's right edge.
Now we need to associate the Line series with its axis. This is accomplished by specifying the axis ID (a unique string value). Set the same ID to the Key property of the axis and the CartesianSeries.AxisXKey/CartesianSeries.AxisYKey property of the series.
In this tutorial, specify the "lineSeriesAxis" ID for the series and axis, as follows:
<mxc:CartesianSeries Name="lineSeries" DataAdapter="{Binding LineSeries.DataAdapter}"
  AxisXKey="lineSeriesAxis">
    <mxc:CartesianLineSeriesView Color="{Binding LineSeries.Color}" />
</mxc:CartesianSeries>

<mxc:CartesianChart.AxesX>
    <!-- ... -->
    <mxc:AxisX Position="Far" Title="Expenses"
       Key="lineSeriesAxis">
        <mxc:AxisX.ScaleOptions>
            <mxc:NumericScaleOptions />
        </mxc:AxisX.ScaleOptions>
    </mxc:AxisX>
</mxc:CartesianChart.AxesX>
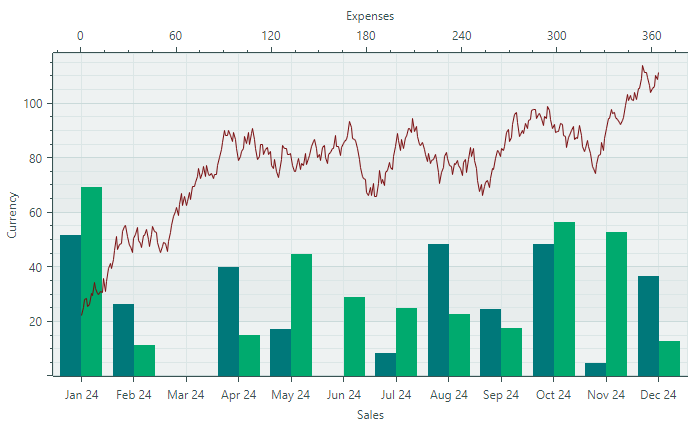
You can run the application to see the chart control displaying three series:
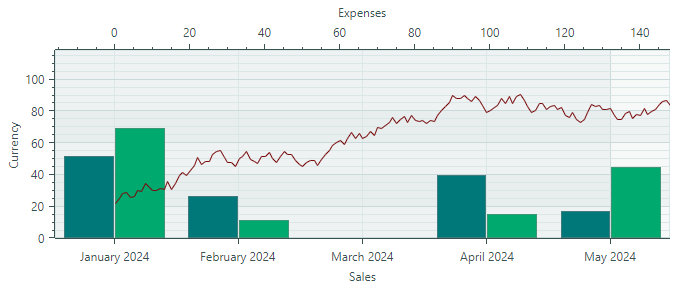
Create a Custom Label Formatter
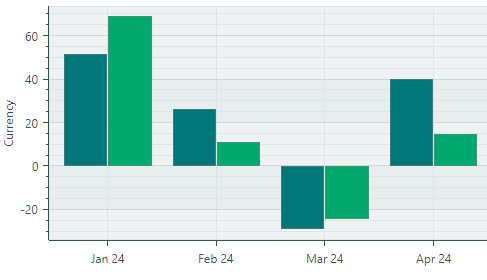
CartesianChart formats labels for major tickmarks based on the axis scaling options. The following image shows label formatting when the Month time unit is applied to the X axis:
The ScaleOptions.LabelFormatter property of an axis allows you to change the display format of the labels. You can use the Eremex.AvaloniaUI.Charts.FuncLabelFormatter class as a label formatter, or create a custom label formatter by implementing the IAxisLabelFormatter interface.
We'll use the FuncLabelFormatter class to create short labels for date-time values of the X axis. In the main View Model, implement a property of the FuncLabelFormatter type that formats labels in a specific manner. In XAML, bind the axis's ScaleOptions.LabelFormatter option to this formatter.
<mxc:AxisX Name="salesAxis" Title="Sales">
    <mxc:AxisX.ScaleOptions>
        <mxc:DateTimeScaleOptions MeasureUnit="Month" LabelFormatter="{Binding MonthFormatter}" />
    </mxc:AxisX.ScaleOptions>
</mxc:AxisX>
public partial class MainWindowViewModel : ViewModelBase
{
    // ...
    [ObservableProperty] FuncLabelFormatter monthFormatter = new(o => String.Format("{0:MMM} {0:yy}", o));
}
Result
Now you can run the application to see the result of this tutorial. The CartesianChart control displays three data series using the Bar and Line series views. The Line series is associated with its own X axis displayed at the top of the chart.
Complete Code
<mx:MxWindow xmlns="https://github.com/avaloniaui"
        xmlns:x="http://schemas.microsoft.com/winfx/2006/xaml"
        xmlns:vm="using:EremexChartsSample.ViewModels"
        xmlns:d="http://schemas.microsoft.com/expression/blend/2008"
        xmlns:mc="http://schemas.openxmlformats.org/markup-compatibility/2006"
        xmlns:mx="https://schemas.eremexcontrols.net/avalonia"
        xmlns:mxc="https://schemas.eremexcontrols.net/avalonia/charts"
        mc:Ignorable="d" d:DesignWidth="800" d:DesignHeight="450"
        x:Class="EremexChartsSample.Views.MainWindow"
        x:DataType="vm:MainWindowViewModel"

        Title="EremexChartsSample">

    <Design.DataContext>
        <!-- This only sets the DataContext for the previewer in an IDE,
             to set the actual DataContext for runtime, set the DataContext property in code (look at App.axaml.cs) -->
        <vm:MainWindowViewModel/>
    </Design.DataContext>

    <mxc:CartesianChart Name="chart1">
        <mxc:CartesianChart.Series>
            <mxc:CartesianSeries Name="barSeries1" DataAdapter="{Binding BarSeries1.DataAdapter}" >
                <mxc:CartesianSideBySideBarSeriesView Color="{Binding BarSeries1.Color}" BarWidth="1" />
            </mxc:CartesianSeries>
            <mxc:CartesianSeries Name="barSeries2" DataAdapter="{Binding BarSeries2.DataAdapter}" >
                <mxc:CartesianSideBySideBarSeriesView Color="{Binding BarSeries2.Color}" />
            </mxc:CartesianSeries>
            <mxc:CartesianSeries Name="lineSeries" DataAdapter="{Binding LineSeries.DataAdapter}"  AxisXKey="lineSeriesAxis" >
                <mxc:CartesianLineSeriesView Color="{Binding LineSeries.Color}" />
            </mxc:CartesianSeries>
        </mxc:CartesianChart.Series>

        <mxc:CartesianChart.AxesX>
            <mxc:AxisX Name="salesAxis" Title="Sales">
                <mxc:AxisX.ScaleOptions>
                    <mxc:DateTimeScaleOptions MeasureUnit="Month" LabelFormatter="{Binding MonthFormatter}" />
                </mxc:AxisX.ScaleOptions>
            </mxc:AxisX>
            <mxc:AxisX Key="lineSeriesAxis" Position="Far" Title="Expenses">
                <mxc:AxisX.ScaleOptions>
                    <mxc:NumericScaleOptions />
                </mxc:AxisX.ScaleOptions>
            </mxc:AxisX>
        </mxc:CartesianChart.AxesX>

        <mxc:CartesianChart.AxesY>
            <mxc:AxisY Title="Currency"/>
        </mxc:CartesianChart.AxesY>

    </mxc:CartesianChart>
</mx:MxWindow>
using Avalonia.Media;
using CommunityToolkit.Mvvm.ComponentModel;
using Eremex.AvaloniaUI.Charts;
using System;

namespace EremexChartsSample.ViewModels;

public partial class MainWindowViewModel : ViewModelBase
{
    public MainWindowViewModel()
    {
        //Init data
        var random = new Random(4);
        var random2 = new Random(0);

        var startDate = new DateTime(DateTime.Now.Year, 1, 1);
        SortedDateTimeDataAdapter barSeries1DataAdapter = new();
        SortedDateTimeDataAdapter barSeries2DataAdapter = new();
        SortedNumericDataAdapter lineSeriesDataAdapter = new();
        for (int i = 0; i < 12; i++)
        {
            var argument = startDate.AddMonths(i);
            barSeries1DataAdapter.Add(argument, random.NextDouble() * 100 - 30);
            barSeries2DataAdapter.Add(argument, random.NextDouble() * 100 - 30);

        }

        double startValue = 20;
        for (int i = 0; i < 365; i++)
        {
            var argument = i;
            var value = startValue + (random2.NextDouble() - 0.5) * 10;
            lineSeriesDataAdapter.Add(argument, value);
            startValue = value;
        }

        // Create data series
        BarSeries1 = new() { Color = Color.FromArgb(255, 0, 120, 122), DataAdapter = barSeries1DataAdapter };
        BarSeries2 = new() { Color = Color.FromArgb(255, 0, 170, 110), DataAdapter = barSeries2DataAdapter };
        LineSeries = new() { Color = Color.FromArgb(255, 120, 10, 12), DataAdapter = lineSeriesDataAdapter };
    }

    [ObservableProperty] SeriesViewModel barSeries1;
    [ObservableProperty] SeriesViewModel barSeries2;
    [ObservableProperty] SeriesViewModel lineSeries;

    [ObservableProperty] CustomLabelFormatter monthFormatter = new(o => String.Format("{0:MMM} {0:yy}", o));
}

public partial class SeriesViewModel : ObservableObject
{
    [ObservableProperty] Color color;
    [ObservableProperty] ISeriesDataAdapter dataAdapter;
}

public class CustomLabelFormatter : IAxisLabelFormatter
{
    readonly Func<object, string> formatFunc;

    public CustomLabelFormatter(Func<object, string> formatFunc)
    {
        this.formatFunc = formatFunc;
    }
    public string Format(object value) =>
        formatFunc(value);
}