Scroll and Zoom in a Chart Control
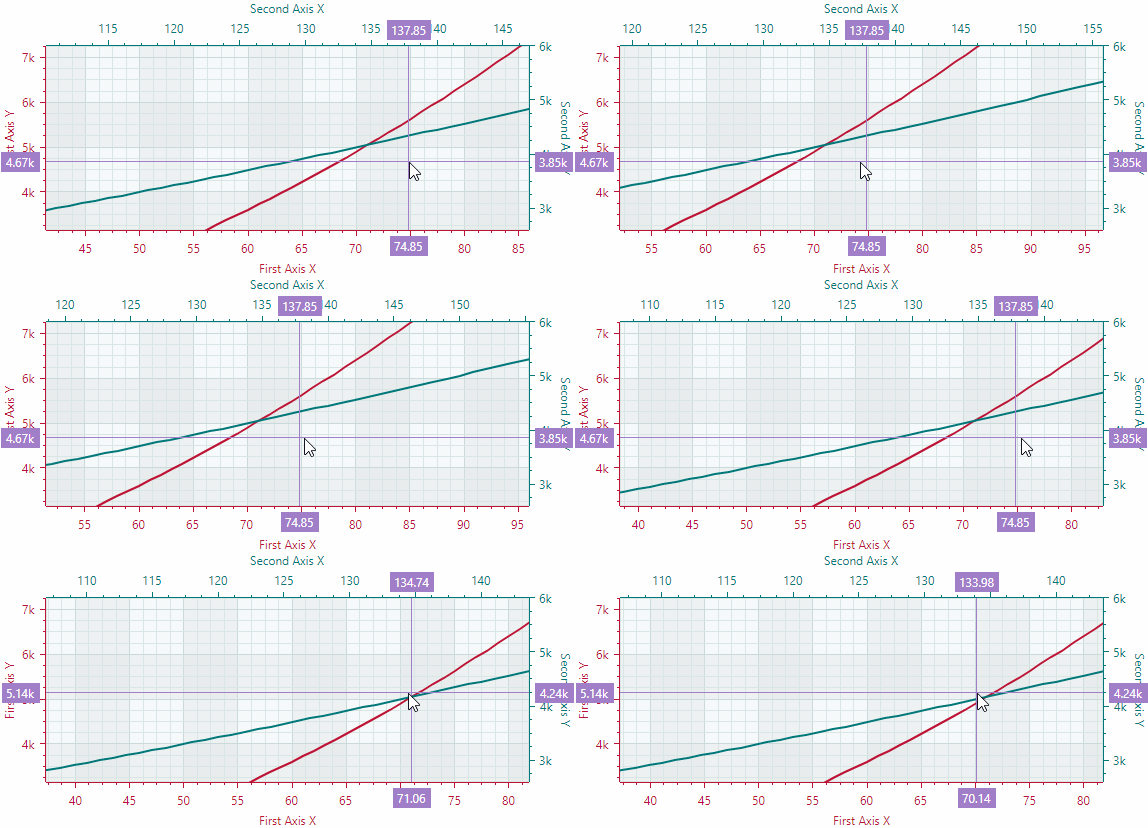
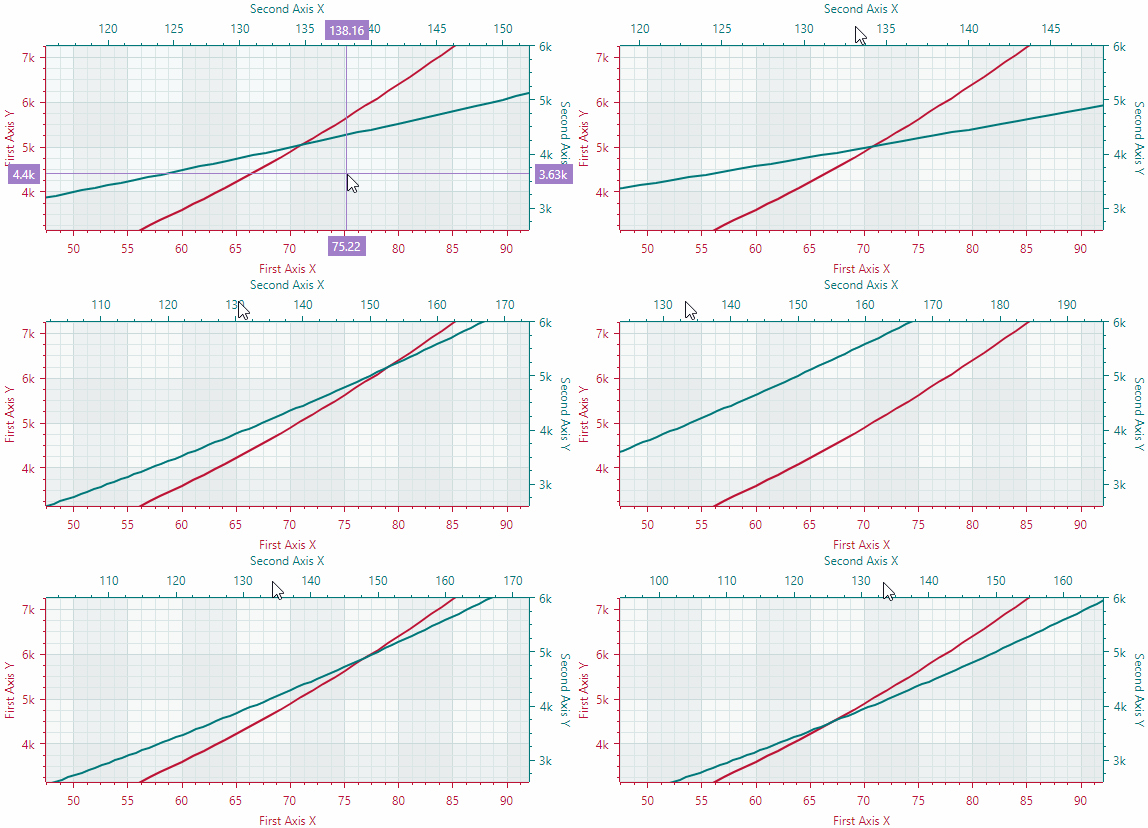
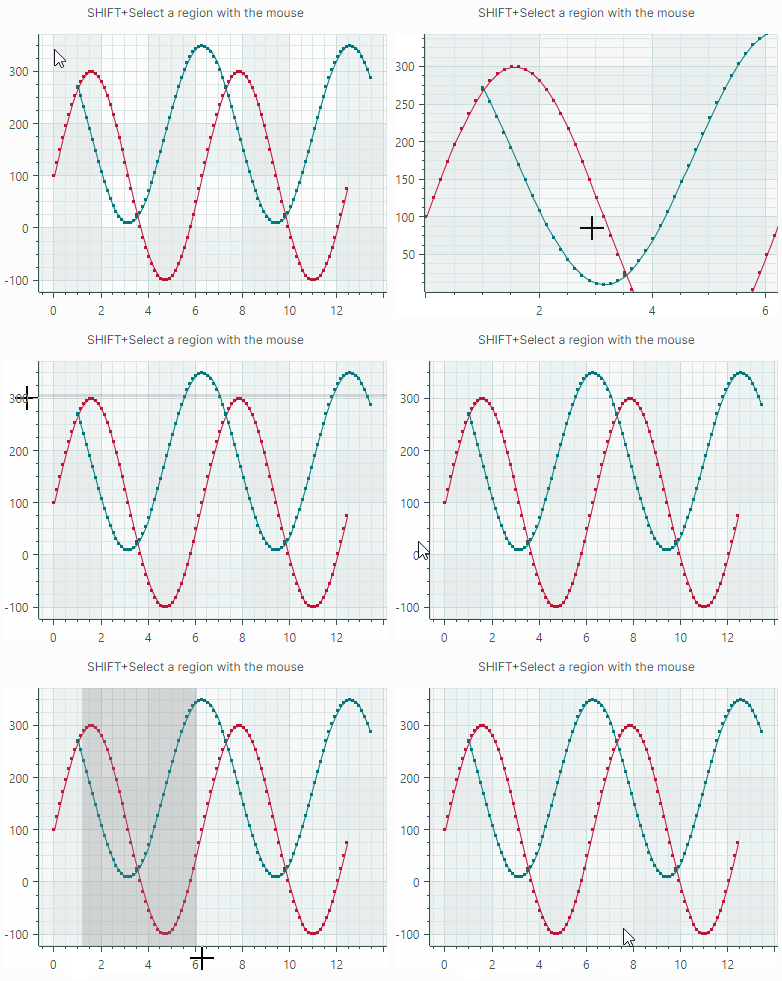
The CartesianChart control supports scroll and zoom operations for the entire view and individual axes. A user can zoom and scroll the chart with the mouse and keyboard. In code, these operations are available through a dedicated API.
Allow Scroll and Zoom Operations
Scroll and zoom operations are enabled by default. The following options allow you to disable these operations for individual axes:
Axis.EnableZoomingAxis.EnableScrolling
<mxc:CartesianChart.AxesX>
    <mxc:AxisX ShowTitle="False" EnableScrolling="False" EnableZooming="False" />
</mxc:CartesianChart.AxesX>
chartControl1.AxesX[0].EnableZooming = false;
The chart control's minimum zoom bounds prevent zooming out too far and thus making the view too small. The total axis ranges define the minimum zoom bounds. To specify a total axis range, use the WholeMin and WholeMax properties of the AxisX.Range/AxisY.Range objects.
<mxc:CartesianChart.AxesY>
    <mxc:AxisY ShowTitle="False">
        <mxc:AxisYRange WholeMin="100" WholeMax="200" AutoCorrectWholeRange="False" AlwaysShowZeroLevel="True" />
    </mxc:AxisY>
</mxc:CartesianChart.AxesY>
See the following topic for more information: Axis Value Range
Scroll and Zoom by Users
Scroll all axes simultaneously
Drag the diagram area with the mouse
or
Press Ctrl+ARROW keys to scroll using the keyboard.
Zoom all axes simultaneously
Scroll the mouse wheel over the diagram area
or
Press Ctrl+'+' to zoom in, and Ctrl+'-' to zoom out.

Scroll an individual axis
- Drag with the mouse within a corresponding axis area.
Zoom an individual axis
- Scroll the mouse wheel within a corresponding axis area.

Zoom into a specific region
- Press and hold SHIFT in the diagram area, and then drag to select the desired rectangle.
Zoom into a value range on an axis
- Press and hold SHIFT in the axis area, and then drag to select the desired range.

Scroll and Zoom in Code
Make a Specific Data Portion Visible
To see a specific data portion in the control's viewport, customize the visible range of the chart control's axes. Use the VisualMin and VisualMax properties of the AxisX.Range/AxisY.Range objects to specify the range of values for the viewport.
chartControl1.AxesX[0].Range.VisualMin = 10;
chartControl1.AxesX[0].Range.VisualMax = 20;
chartControl1.AxesY[0].Range.VisualMin = -50;
chartControl1.AxesY[0].Range.VisualMax = 50;
Imitate a User Scroll Operation in Code
Use the CartesianChart.Scroll method to scroll the series data along specific axes or all axes simultaneously. This method imitates a scroll operation performed by users.
The method's signature is shown below:
public void Scroll(double deltaX, double deltaY, IEnumerable<Axis>? axes = null)
deltaX— Specifies the number of pixels to scroll along a horizontal axis (axes). Positive values correspond to scrolling to the right; negative values correspond to scrolling to the left.deltaY— Specifies the number of pixels to scroll along a vertical axis (axes). Positive values correspond to scrolling to the top; negative values correspond to scrolling to the bottom.axes— The axes along which to scroll the viewport. If this parameter is omitted, the viewport is scrolled along all axes simultaneously.
//Scroll along all X axes horizontally by 10 units
chartControl1.Scroll(10, 0);

//Scroll along all Y axes vertically by 10 units
chartControl1.Scroll(0, 10);

//Scroll along the first X axis
AxisX axisX = chartControl1.AxesX[0];
chartControl1.Scroll(10, 0, new[] { axisX });
Imitate a User Zoom Operation in Code
Use the CartesianChart.Zoom method to zoom the series data along specific axes or all axes simultaneously. This method imitates zoom operations performed by users.
The method's signature is shown below:
public void Zoom(double delta, IEnumerable<Axis>? axes = null)
delta— Specifies the number of mouse wheel scroll up/down actions. This value determines a zoom factor.- Positive values correspond to mouse wheel scroll up (zoom in) operations. A value of
1corresponds to a single scroll up action. - Negative values correspond to mouse wheel scroll down (zoom out) operations. A value of
-1corresponds to a single scroll down action.
- Positive values correspond to mouse wheel scroll up (zoom in) operations. A value of
axes— The axes along which to zoom the viewport. If this parameter is omitted, the viewport is zoomed along all axes simultaneously.
//Zoom in (imitate a single scroll up action)
chartControl1.Zoom(1);

//Zoom out (imitate a single scroll down action)
chartControl1.Zoom(-1);