Point Series View
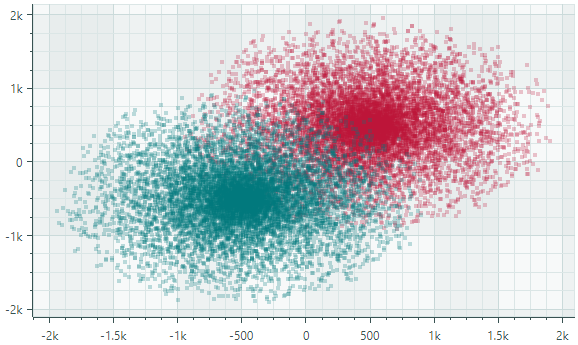
The Point Series View (CartesianPointSeriesView) plots individual points. Each point is addressed by X and Y values. The following image shows a sample CartesianPointSeriesView that displays two series of scattered points, each painted in its own color.
Create a Point Series View
To create a Point Series View, add a CartesianSeries object to the CartesianChart.Series collection, and initialize the CartesianSeries.View with a CartesianPointSeriesView instance.
The following code shows how to create a Point Area Series View in XAML and code-behind.
<mxc:CartesianChart x:Name="chartControl">
    <mxc:CartesianChart.Series>
        <mxc:CartesianSeries Name="pointSeries1" DataAdapter="{Binding DataAdapter}" >
            <mxc:CartesianPointSeriesView Color="Red" MarkerSize="2"/>
        </mxc:CartesianSeries>
    </mxc:CartesianChart.Series>
</mxc:CartesianChart>
CartesianSeries series = new CartesianSeries();
chartControl.Series.Add(series);
double[] args = new double[] {3,2,1,2,3,4,5,4 };
double[] values = new double[] { -1,0,1,2,3,2,1,0 };
// Use ScatterDataAdapter since points are not sorted by the X coordinate
series.DataAdapter = new ScatterDataAdapter(args, values);
series.View = new CartesianPointSeriesView()
{
    Color = Avalonia.Media.Colors.Blue,
    MarkerSize = 4,
};
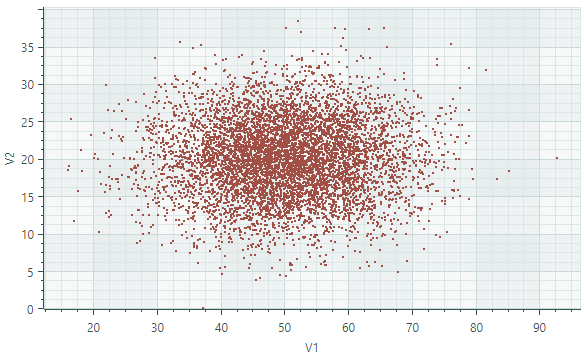
Example - Use a Point Series View to Display a Cluster of Points
In this example, the Point Series View is used to display points randomly scattered along the numeric X and Y axes. Points in the source data series are not sorted by the X coordinate. To provide unsorted points to the Series View, the ScatterDataAdapter adapter is used.
<mx:MxWindow xmlns="https://github.com/avaloniaui"
        xmlns:x="http://schemas.microsoft.com/winfx/2006/xaml"
        xmlns:vm="using:ChartPointSeriesView.ViewModels"
        xmlns:d="http://schemas.microsoft.com/expression/blend/2008"
        xmlns:mc="http://schemas.openxmlformats.org/markup-compatibility/2006"
        xmlns:mx="https://schemas.eremexcontrols.net/avalonia"
        xmlns:mxc="https://schemas.eremexcontrols.net/avalonia/charts"
        mc:Ignorable="d" d:DesignWidth="800" d:DesignHeight="450"
        x:Class="ChartPointSeriesView.Views.MainWindow"
        x:DataType="vm:MainWindowViewModel"
        Icon="/Assets/EMXControls.ico"
        Title="ChartPointSeriesView"
        Width="600" Height="400">

    <Design.DataContext>
        <vm:MainWindowViewModel/>
    </Design.DataContext>

    <mxc:CartesianChart x:Name="chartControl">
        <mxc:CartesianChart.Series>
            <mxc:CartesianSeries Name="pointSeries1" DataAdapter="{Binding PointSeriesVM1.DataAdapter}" >
                <mxc:CartesianPointSeriesView Color="{Binding PointSeriesVM1.Color}" MarkerSize="2"/>
            </mxc:CartesianSeries>
        </mxc:CartesianChart.Series>
        <mxc:CartesianChart.AxesX>
            <mxc:AxisX Name="xAxis" Title="V1" />
        </mxc:CartesianChart.AxesX>
        <mxc:CartesianChart.AxesY>
            <mxc:AxisY Title="V2"/>
        </mxc:CartesianChart.AxesY>
    </mxc:CartesianChart>
</mx:MxWindow>
using CommunityToolkit.Mvvm.ComponentModel;
using Eremex.AvaloniaUI.Charts;
using System.Collections.Generic;
using System;
using Avalonia.Media;
using Avalonia;

namespace ChartPointSeriesView.ViewModels;

public partial class MainWindowViewModel : ViewModelBase
{
    [ObservableProperty] SeriesViewModel pointSeriesVM1;

    public MainWindowViewModel()
    {
        PointSeriesVM1 = new()
        {
            Color = Color.FromUInt32(0xffa24f46),
            DataAdapter = GenerateRandomData()
        };
    }

    private static Random random = new Random();
    private static double GenerateNormalValue(double mean, double stdDev)
    {
        double u1 = 1.0 - random.NextDouble();
        double u2 = 1.0 - random.NextDouble();
        double randStdNormal = Math.Sqrt(-2.0 * Math.Log(u1)) * Math.Sin(2.0 * Math.PI * u2);
        return mean + stdDev * randStdNormal;
    }

    public static ScatterDataAdapter GenerateRandomData()
    {
        int count = 7000;
        double xMean= 50, xStdDev= 10, yMean = 20, yStdDev = 5;
        List<double> args = new List<double>();
        List<double> values = new List<double>();
        for(int i = 0; i < count; i++)
        {
            double x = GenerateNormalValue(xMean, xStdDev);
            double y = GenerateNormalValue(yMean, yStdDev);
            args.Add(x);
            values.Add(y);
        }
        return new ScatterDataAdapter(args, values);
    }
}

public partial class SeriesViewModel : ObservableObject
{
    [ObservableProperty] Color color;
    [ObservableProperty] ScatterDataAdapter dataAdapter;
}
Data for the Point Series View
You can use the following data adapters to provide data for Point Series Views:
Numeric X Values:
FormulaDataAdapterScatterDataAdapterSortedNumericDataAdapter
Date and Time X Values:
SortedDateTimeDataAdapterSortedTimeSpanDataAdapter
Qualitative X Values:
QualitativeDataAdapter
Point Series View Settings
Color— Specifies the color used to paint the series.-
MarkerImage— Gets or sets an image to use as custom point markers. If no image is specified, default square-shaped markers are displayed. You can use anSvgImageclass instance to specify an SVG image.The
MarkerImageproperty is declared with the[Content]attribute, which allows you to define an image directly between the <CartesianPointSeriesView> tags.<mxc:CartesianPointSeriesView> <SvgImage Source="avares://Demo/Assets/circle.svg" /> </mxc:CartesianPointSeriesView>SVG files contain predefined colors for SVG elements. To make these colors match your data series color, you can either:
- Manually edit the source SVG image file beforehand
- Use the
MarkerImageCssproperty to dynamically customize styles for SVG elements. The styles are applied when point markers are rendered.
-
MarkerImageCss— Specifies CSS styles for runtime customization of an SVG image defined by theMarkerImageproperty. The primary use case is replacing SVG element colors with the series color (Color). Include the{0}placeholder to insert the value of theColorproperty in the CSS code.For example, when the
MarkerImageproperty contains an SVG image with a circle element, the following CSS code styles thecirclewith an Orange fill (using the series color) and Dark Red border:<mxc:CartesianPointSeriesView Color="orange" MarkerImageCss="circle {{fill:{0};stroke:darkred;}}"> <SvgImage Source="avares://Demo/Assets/circle.svg" /> </mxc:CartesianPointSeriesView>See also: Example - Create a Lollipop Series View and Use Custom SVG Markers.
-
MarkerSize— Specifies the size of point markers. ShowInCrosshair— Specifies the visibility of the crosshair chart label for the current series. See Customize Chart Labels of the Crosshair.