Summaries
The DataGridControl allows you to calculate summaries (aggregate functions) against cell values. Two summary types are supported:
- Total summaries, calculated against all rows.
- Group summaries, calculated against groups of rows when data is grouped.
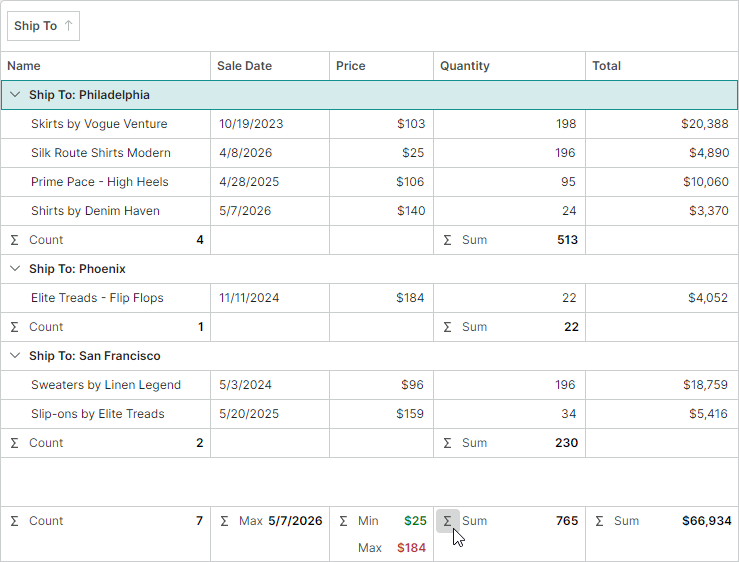
The main summary calculation features include:
- Built-in summary functions: Sum, Min, Max, Count, and Average.
- Runtime management — Users can click the Σ button in the footer cell to add summaries or invoke the Summary Editor dialog for advanced summary operations.
- Multiple summaries per column — Each column can display multiple summaries calculated against that column's values.
- Cross-column summaries — You can calculate a summary against one column and display it in another.
- Custom summaries — You can handle the
CustomSummaryevent to calculate a custom aggregate function according to your logic.
Total Summaries
Total summaries are calculated across all rows and shown in the control's footer.
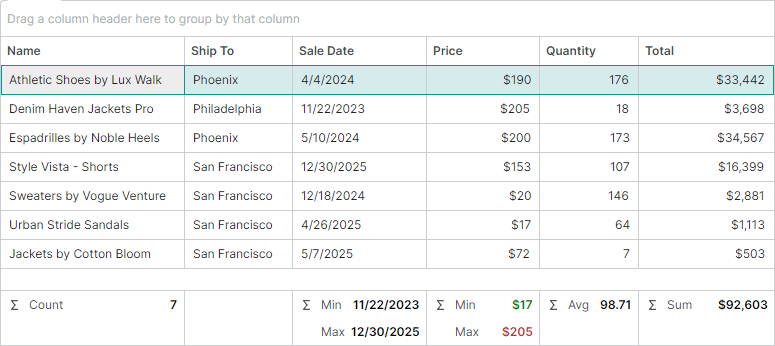
Enable Total Summaries
Set the ShowTotalSummaries property to true to display the summary footer and thus enable total summary calculation. The summary footer is displayed at the bottom of the DataGridControl, below all rows. Initially, this footer is hidden.
The summary footer contains summary cells for all columns. If user summary customization is enabled (default) the summary cells contain the Σ button used to show a summary menu and the summary editor.
Related API
ShowTotalSummaries— Gets or sets whether the total summary footer is displayed.TotalSummaryPanelMinHeight— Gets or sets the minimum height of the total summary footer.
Define Total Summaries
Use the TotalSummaries collection to define total summaries. Items in this collection are encapsulated by the SummaryItem class. Each SummaryItem object specifies the field to summarize, the summary type, the column in which to display the result, and other settings.
xmlns:mxdc="clr-namespace:Eremex.AvaloniaUI.Controls.DataControl;assembly=Eremex.Avalonia.Controls"

<mxdg:DataGridControl x:Name="dataGrid" ShowTotalSummaries="True">
    <mxdg:DataGridControl.TotalSummaries>
        <mxdc:SummaryItem FieldName="Name" SummaryType="Count" />
        <mxdc:SummaryItem FieldName="SaleDate" SummaryType="Min" ShowInColumn="Total" />
        <mxdc:SummaryItem FieldName="SaleDate" SummaryType="Max" ShowInColumn="Total" />
        <mxdc:SummaryItem FieldName="Price" SummaryType="Min" />
        <mxdc:SummaryItem FieldName="Price" SummaryType="Max" />
        <mxdc:SummaryItem FieldName="Quantity" SummaryType="Average" />
        <mxdc:SummaryItem FieldName="Total" SummaryType="Sum" />
    </mxdg:DataGridControl.TotalSummaries>
</mxdg:DataGridControl>
Related API
TotalSummaries— Provides access to the collection of summary items (SummaryItemobjects) that define total summaries.SummaryItem.FieldName— Gets or sets the name of the data field whose values are used to calculate the summary.SummaryItem.ShowInColumn— Gets or sets the field name of the column that displays the summary value. If this property is not set, the summary is displayed in the column bound toFieldName.SummaryItem.SummaryType— Gets or sets the type of the aggregate function (Sum,Min,Max,Count, orAverage).SummaryItem.Label— Gets or sets a custom label to display instead of the default summary label. The default summary label displays the summary function. If the summary is associated with another column (seeShowInColumn), the summary label also displays the caption of the column bound toSummaryItem.FieldName.
Group Summaries
Group summaries allow you to calculate aggregate functions against groups of rows when data is grouped by columns. Group summaries are displayed in group footers.
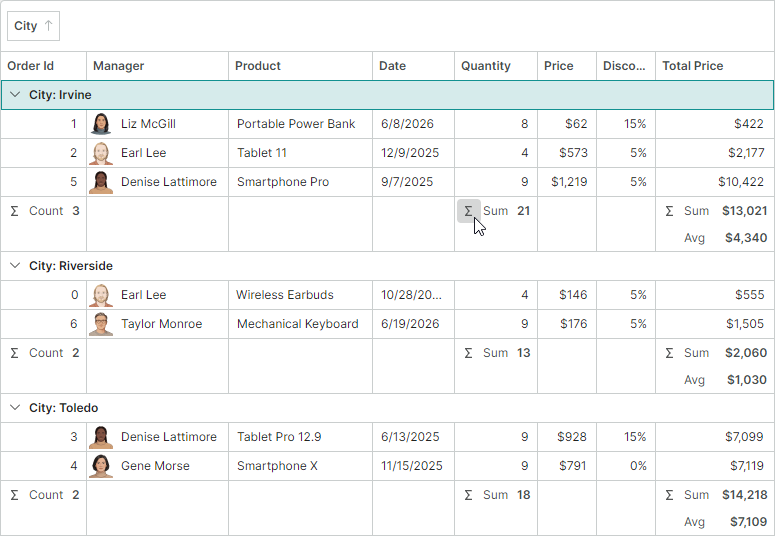
Enable Group Summaries
Set the ShowGroupSummaries property to true to display group summary footers (initially, they are hidden) and thus enable group summary calculation. Group summary footers are displayed below all groups of rows. Each grouping level contains its own footer.
Related API
ShowGroupSummaries— Gets or sets whether group footers that display group summaries are displayed.GroupSummaryRowMinHeight— Gets or sets the minimum height of group footers.
Define Group Summaries
Use the GroupSummaries collection to define group summaries. As with the TotalSummaries collection, items in the GroupSummaries collection are represented by the SummaryItem class. Each SummaryItem object specifies the field to summarize, the summary type, the column in which to display the result, and other settings.
<mxdg:DataGridControl x:Name="dataGrid" ShowGroupSummaries="True">
    <mxdg:DataGridControl.GroupSummaries>
        <mxdc:SummaryItem FieldName="OrderId" SummaryType="Count" />
        <mxdc:SummaryItem FieldName="Quantity" SummaryType="Sum" />
        <mxdc:SummaryItem FieldName="TotalPrice" SummaryType="Sum" />
        <mxdc:SummaryItem FieldName="TotalPrice" SummaryType="Average" />
    </mxdg:DataGridControl.GroupSummaries>
</mxdg:DataGridControl>
Related API
GroupSummaries— Provides access to the collection of summary items (SummaryItemobjects) that define group summaries.SummaryItem.FieldName— Gets or sets the name of the data field whose values are used to calculate the summary.SummaryItem.ShowInColumn— Gets or sets the field name of the column that displays the summary value. If this property is not set, the summary is displayed in the column bound toFieldName.SummaryItem.SummaryType— Gets or sets the type of the aggregate function (Sum,Min,Max,Count, orAverage).SummaryItem.Label— Gets or sets a custom label to display instead of the default summary label. The default summary label displays the summary function. If the summary is associated with another column (seeShowInColumn), the summary label also displays the caption of the column bound toSummaryItem.FieldName.
User Summary Customizations
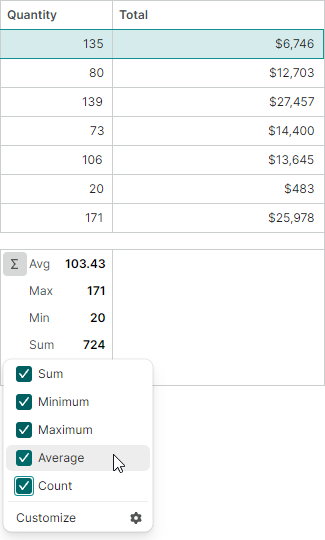
Summaries can be edited by users by default. In this mode, summary cells display the Σ button, used to invoke the summary menu:
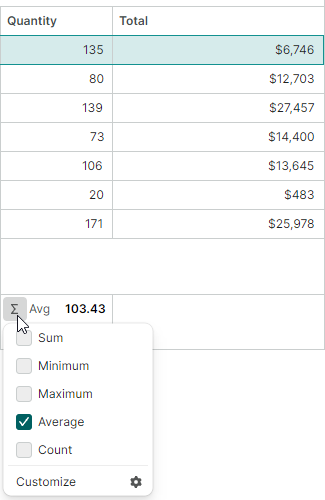
Users can use this menu to:
-
Add or remove summaries by toggling checkboxes next to summary functions.
-
Select
Customizeto invoke theSummary Editordialog.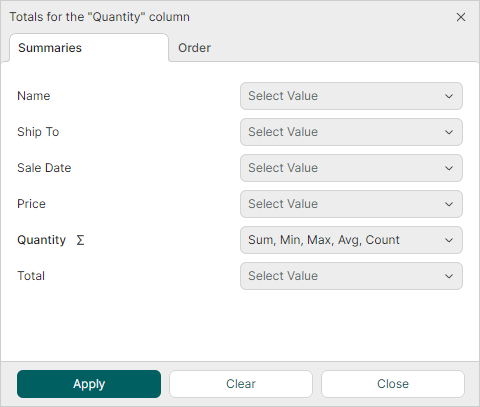
In this dialog's
Summariestab, users can create cross-column summaries (summaries calculated against one column, but shown in another column).The
Ordertab allows users to change the display order of the existing summaries.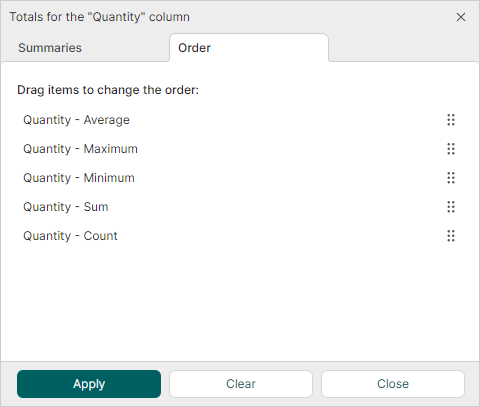
Related API
AllowEditingTotalSummaries— Gets or sets whether users can edit total summaries.AllowEditingGroupSummaries— Gets or sets whether users can edit group summaries.
These properties only affect user capabilities to modify summaries and do not impact summary calculation performed in code.
Custom Summaries
Custom summaries allow you to calculate aggregate values using your own logic. You can define custom total summaries and custom group summaries.
To add a custom summary, do the following:
-
Create a
SummaryItemobject and set itsSummaryItem.SummaryTypeproperty toCustom.- To calculate a custom total summary, add this
SummaryItemto theTotalSummariescollection. - To calculate a custom group summary, add this
SummaryItemto theGroupSummariescollection.
- To calculate a custom total summary, add this
-
Handle the
CustomSummaryevent to manually calculate a value for thisSummaryItem.Set the
e.SummaryValueevent parameter to supply your custom result.While handling the
CustomSummaryevent, usee.RowIndexescollection to iterate through target rows. Items in this collection specify indexes of rows against which to calculate a custom summary. When calculating a custom total summary, the indexes refer to all DataGrid rows. When calculating a custom group summary, the CustomSummary event is raised for each group of rows, and indexes in thee.RowIndexescollection refer to rows within each group.Tip
Row indexes allow you to address rows when using the DataGrid's row-wise API (for instance,
DataGridControl.GetCellValue)
Example - Calculate a custom total summary
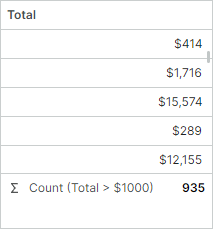
The following example creates a custom total summary that calculates the number of orders that exceed the $1000 amount.
<!-- XAML -->
<mxdg:DataGridControl x:Name="dataGrid" CustomSummary="OnCustomSummary">
    <mxdg:DataGridControl.TotalSummaries>
        <mxdc:SummaryItem FieldName="Total" SummaryType="Custom" Label="Count (Total > $1000)" />
    </mxdg:DataGridControl.TotalSummaries>
</mxdg:DataGridControl>
// Code-behind
void OnCustomSummary(object sender, DataGridCustomSummaryEventArgs e)
{
    int largeOrdersCount = 0;
    foreach (int rowIndex in e.RowIndexes)
    {
        if ((decimal)dataGrid.GetCellValue(rowIndex, e.SummaryItem.FieldName) > 1000m)
            largeOrdersCount++;
    }
    e.SummaryValue = largeOrdersCount.ToString();
}
Related API
CustomSummary— Occurs when a summary value is calculated. Use theSummaryValueevent parameter to supply a custom summary value.
Get Summary Values
You can retrieve calculated summary values in code using the following methods:
DataGridControl.GetTotalSummaryValue— Returns the calculated value of a total summary.DataGridControl.GetGroupSummaryValue— Returns the calculated value of a group summary for a specific group row. TherowIndexparameter identifies the index of a target group row whose child rows are used to calculate a summary.