Charts
The Eremex Controls Library for Avalonia UI includes powerful chart controls that help you visualize data as 2D charts. The chart controls' graphics rendering is optimized to display large data. The controls maintain high performance even when series contain millions of points.
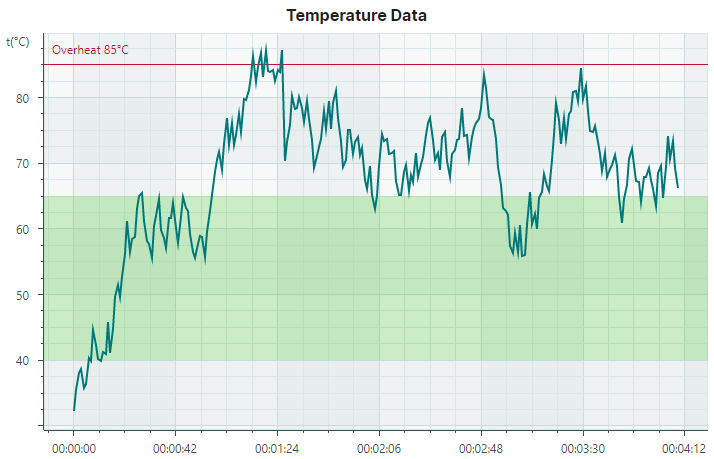
CartesianChart
CartesianChart allows you to plot a diagram on a Cartesian coordinate system.
Features
- An unlimited number of data series within each chart
- Multiple axes support
- Multiple axis types: Numeric, Date-Time, Time Span, Qualitative, and Logarithmic
- Scrolling and zooming all axes at the same time
- Scrolling and zooming individual axes
- High-performance when displaying large data
- Real-time data visualization
- Crosshair
- Strips and constant lines
- Using the MVVM design pattern to provide data and customize chart options
- Displaying rapidly changing real-time data. Use a special data adapter to implement a moving viewport
Series Types
- Line Series View
- Scatter Line Series View
- Point Series View (with SVG marker support)
- Area Series View
- Step Line Series View
- Step Area Series View
- Range Area Series View
- Bar Series View
- Range Bar Series View
- Candlestick Series View
See the following topics for more information:
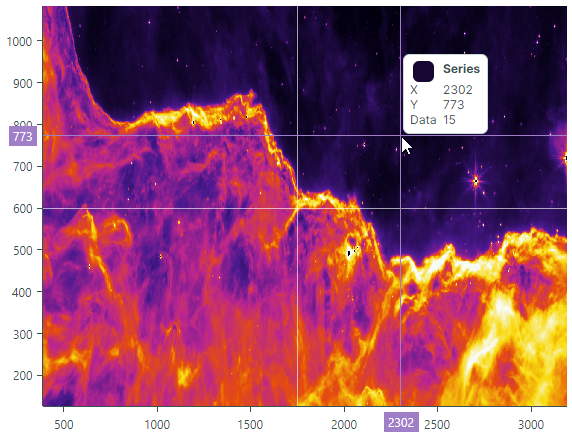
Heatmap
Allows you to create a two-dimensional heat map, a chart that visualizes data using colored squares.
Features
- Custom color encoding
- Grayscale colorization
- Customization of the X and Y axes
- Crosshair
- Strips and constant lines
- Scroll and zoom with the mouse and keyboard
- Export the result of data colorization to a bitmap
See the following topic to learn more:
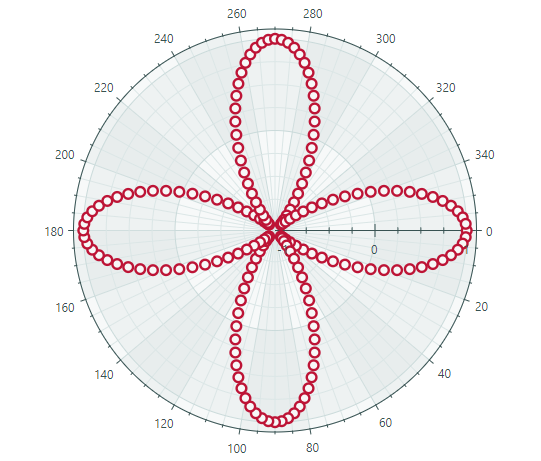
PolarChart
Plots a diagram on a polar coordinate system.
Features
- Crosshair
- Strips and constant lines
- Using the MVVM design pattern to provide data and customize chart options
- Sweep direction and start angle (for the X axis)
Series Types
- Point Series View
- Line Series View
- Scatter Line Series View
- Area Series View
- Range Area Series View
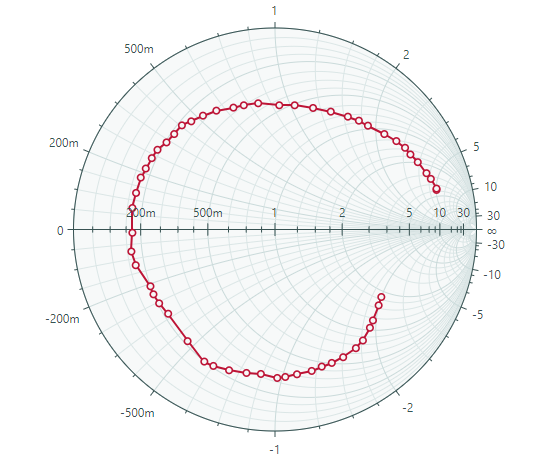
SmithChart
Allows you to create a Smith chart.
Features
- Crosshair
- Using the MVVM design pattern to provide data and customize chart options
Series Types
- Point Series View
- Scatter Line Series View