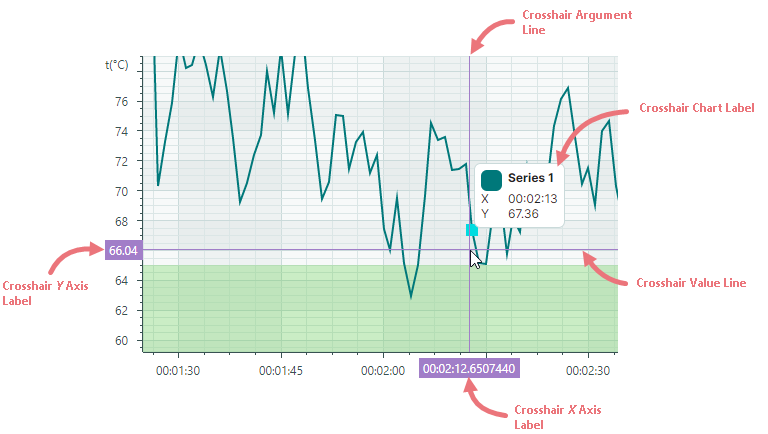
Crosshair
The Cartesian Chart control includes a crosshair that allows you to see exact series values at the current cursor position. Rendered as a pair of horizontal and vertical lines, the crosshair follows the mouse pointer as it hovers over the diagram area. It displays a series label (or multiple labels for multiple series) that shows the series value, and highlights the current X and Y coordinates on the axes.
To customize display settings of the crosshair, or disable this feature, initialize the CartesianChart.CrosshairOptions property with an instance of the Eremex.AvaloniaUI.Charts.CrosshairOptions class. Then use the properties exposed by the CrosshairOptions class to adjust the crosshair settings as needed.
Disable the Crosshair
The CrosshairOptions.ShowCrosshair property allows you to disable the crosshair.
<mxc:CartesianChart x:Name="chartControl1" >
    <mxc:CartesianChart.CrosshairOptions>
        <mxc:CrosshairOptions ShowCrosshair="False"/>
    </mxc:CartesianChart.CrosshairOptions>
    <!-- ... -->
</mxc:CartesianChart>
Disable Individual Lines and Axis Labels of the Crosshair
The CrosshairOptions.ShowArgumentLine and CrosshairOptions.ShowValueLine properties can be used to hide the vertical and horizontal line of the crosshair, respectively. To prevent crosshair labels from being displayed for the X and Y axes, use the CrosshairOptions.ShowArgumentLabel and CrosshairOptions.ShowValueLabel properties.
The following example hides the crosshair's vertical line and label for the X axis:
<mxc:CartesianChart x:Name="chartControl1" >
    <mxc:CartesianChart.CrosshairOptions>
        <mxc:CrosshairOptions ShowArgumentLabel="False" ShowValueLabel="False"/>
    </mxc:CartesianChart.CrosshairOptions>
    <!-- ... -->
</mxc:CartesianChart>
Customize Crosshair Series Labels
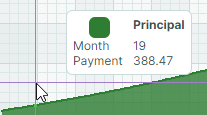
The crosshair series labels display the names and current values of the series.
Format Values in Crosshair Series Labels
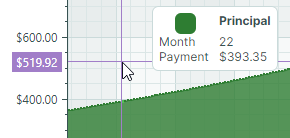
The values displayed in the crosshair labels use default formats initially:
To format these values in a custom manner, create a formatter object and assign it to the Axis.ScaleOptions.CrosshairLabelFormatter property. Axis values can be formatted similarly (see the Axis.ScaleOptions.LabelFormatter property).
You can implement a custom label formatter based on a function/expression using the Eremex.AvaloniaUI.Charts.FuncLabelFormatter object.
The following example creates a formatter object that formats numeric values as currency. This formatter is used to format Y axis values and values in the crosshair series label.
<mxc:CartesianChart.AxesY>
    <mxc:AxisY Title="Payment">
        <mxc:AxisY.ScaleOptions>
            <mxc:NumericScaleOptions
                CrosshairLabelFormatter="{Binding CurrencyFormatter}"
                LabelFormatter="{Binding CurrencyFormatter}"/>
        </mxc:AxisY.ScaleOptions>
    </mxc:AxisY>
</mxc:CartesianChart.AxesY>
public partial class MainViewModel : ViewModelBase
{
[ObservableProperty]
FuncLabelFormatter currencyFormatter = new(o => String.Format("{0:c}", o));
}
Hide a Series in the Crosshair
A series view's CrosshairSeriesViewBase.ShowInCrosshair property specifies the visibility of this series in the crosshair label.
The following code defines two series (Interest and Principal). The ShowInCrosshair property is set to false for the first series to hide it in the crosshair:
<mxc:CartesianChart.Series>
    <mxc:CartesianSeries DataAdapter="{Binding InterestSeriesDataAdapter}" SeriesName="Interest">
        <mxc:CartesianAreaSeriesView Color="#F9A825" Transparency="0.2"
          MarkerSize="2" ShowMarkers="True"
          ShowInCrosshair="False" />
    </mxc:CartesianSeries>

    <mxc:CartesianSeries DataAdapter="{Binding PrincipalSeriesDataAdapter}" SeriesName="Principal">
        <mxc:CartesianAreaSeriesView Color="#2E7D32" Transparency="0.2" MarkerSize="2" ShowMarkers="True" />
    </mxc:CartesianSeries>
</mxc:CartesianChart.Series>
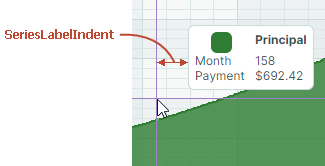
Horizontal Indent of the Crosshair Series Label
The CrosshairOptions.SeriesLabelIndent property allows you to adjust the horizontal distance between the crosshair series label and the crosshair vertical line. The property's default value is 2.
<mxc:CartesianChart.CrosshairOptions>
    <mxc:CrosshairOptions SeriesLabelIndent="30"/>
</mxc:CartesianChart.CrosshairOptions>
Show an Exact or Interpolated Value in Crosshair Series Labels
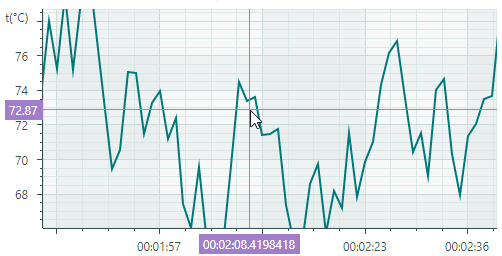
Cartesian Chart supports series that consist of sorted discrete data points. For these series, the crosshair lines do not always intersect data points, but are most often displayed between them.
You can use the CartesianSortedLineSeriesView.CrosshairMode property to specify whether the crosshair label snaps to the nearest data point, or displays an interpolated value. The following options are available:
CrosshairSeriesMode.Point— The crosshair label snaps to the nearest data point and displays its value.
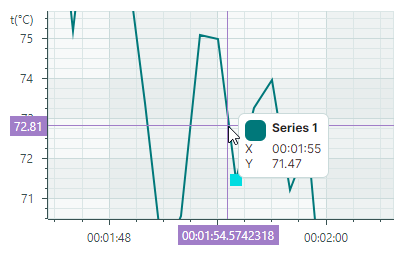
CrosshairSeriesMode.Interpolate— The crosshair series label displays an interpolated value of the point at the intersection of the vertical crosshair line with the chart.
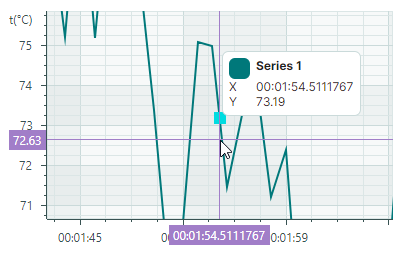
The following code shows how to customize the CrosshairMode option:
<mxc:CartesianChart.Series>
    <mxc:CartesianSeries DataAdapter="{Binding Series.DataAdapter}">
        <mxc:CartesianLineSeriesView Color="{Binding Series.Color}" Thickness="2" CrosshairMode="Interpolate"/>
    </mxc:CartesianSeries>
</mxc:CartesianChart.Series>
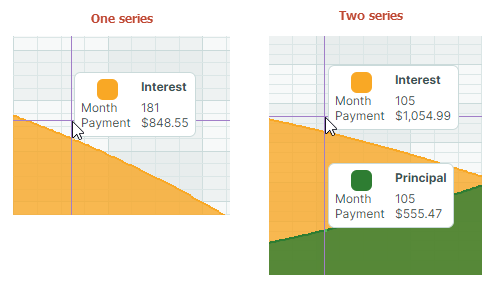
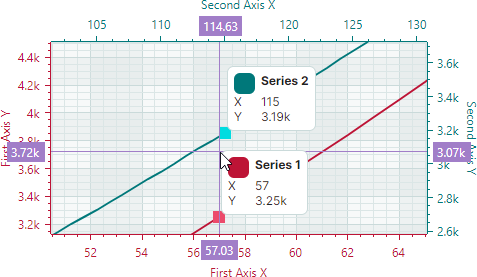
Customize Crosshair Labels for Multiple Series
Label Display Mode
When the Cartesian Chart contains multiple series, the crosshair displays a label for each series:
The CrosshairOptions.SeriesLabelMode property specifies whether and how multiple series labels are combined. The following options are available:
CrosshairSeriesLabelMode.Smart(default) — Each series displays its own crosshair label. When labels overlap, they are combined in a single label.
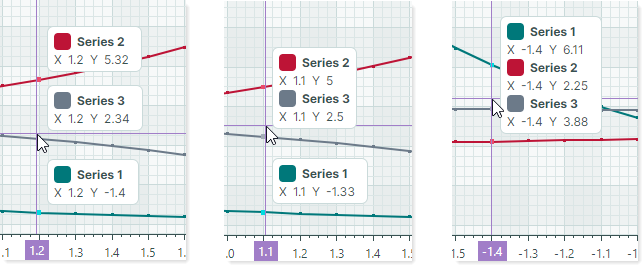
CrosshairSeriesLabelMode.ForEachSeries— Each series displays its own crosshair label. Labels may overlap in this mode.
CrosshairSeriesLabelMode.ForNearestSeries— A crosshair label is displayed only for the series nearest the cursor.
CrosshairSeriesLabelMode.OneForAllSeries— The crosshair displays a single label that combines information from all series.
The following example enables a single crosshair label when multiple series are present.
<mxc:CartesianChart.CrosshairOptions>
    <mxc:CrosshairOptions SeriesLabelMode="OneForAllSeries"/>
</mxc:CartesianChart.CrosshairOptions>
Series Sorting
When multiple series are combined in a single crosshair label, you can use the CrosshairOptions.SeriesLabelItemSortMode property to specify the display order of the series in the label. This property can be set to the following values:
-
CrosshairSeriesLabelItemSortMode.BySeries(default) — Sorts series by the order in which these series are added to theCartesianChart.Seriescollection.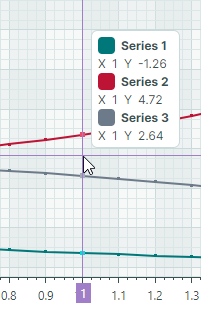
-
CrosshairSeriesLabelItemSortMode.ByValue— Sorts series by their Y values.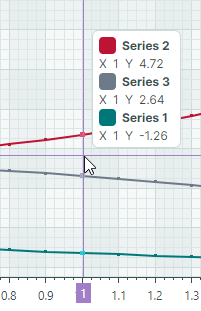
Show Delay
Use the CrosshairOptions.SeriesLabelShowDelay property to specify the delay (in milliseconds) before a crosshair series label is displayed.
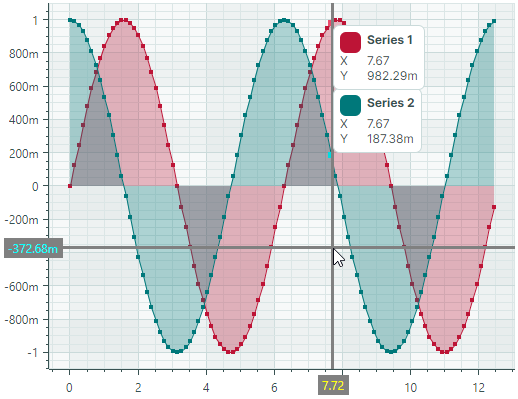
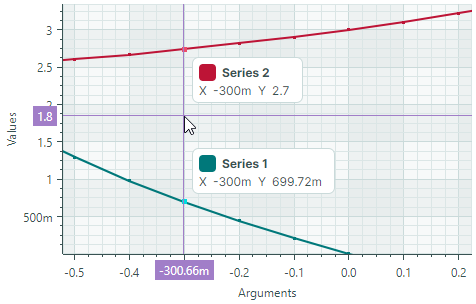
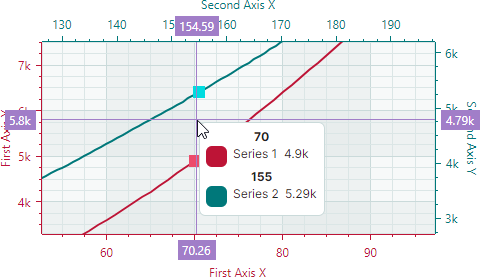
Include Only Series Near the Cursor
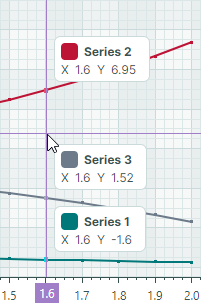
By default, linear charts display crosshair labels for all series that have data points at the current argument value.
The chart control allows you to limit crosshair labels to series near the cursor. Use the CrosshairOptions.MaxPickDistance property to specify the range within which to search for data points to include in crosshair labels. For regular linear charts, the MaxPickDistance property specifies the maximum vertical distance (in pixels) upward or downward.
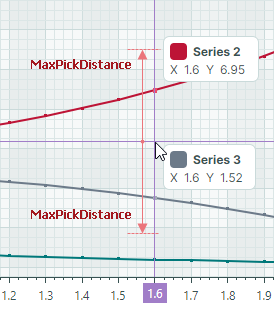
In the image above, only data points from the Series 1 and Series 3 lie within the range limited by a custom MaxPickDistance value. The data point from the Series 2 (red line) is beyond this range and is not shown.
For Scatter Line views, the MaxPickDistance property specifies the radius of a circular area around the cursor within which to search for data points.
Tip
To display a crosshair label for a single series nearest the cursor, set the CrosshairOptions.SeriesLabelMode property to ForNearestSeries. See Label Display Mode.
Customize Crosshair Lines and Labels on the X and Y Axes
A chart control's CrosshairOptions object contains a set of properties that allow you to change the visual settings of crosshair lines, X axis label, and Y axis label.
ArgumentColor— The background color of the crosshair X axis labels.ArgumentLineThickness— The thickness of the crosshair argument line.ArgumentTextColor— The foreground (text) color of the crosshair X axis labels.ValueColor— The background color of the crosshair Y axis labels.ValueLineThickness— The thickness of the crosshair value line.ValueTextColor— The foreground (text) color of the crosshair Y axis labels.
The following XAML code demonstrates how to customize these settings for a sample chart control. The crosshair line thickness is set to 3. The crosshair labels have a gray background, but different text colors: yellow for the X-axis labels and cyan for the Y-axis labels.