Full-Stacked Area Series View
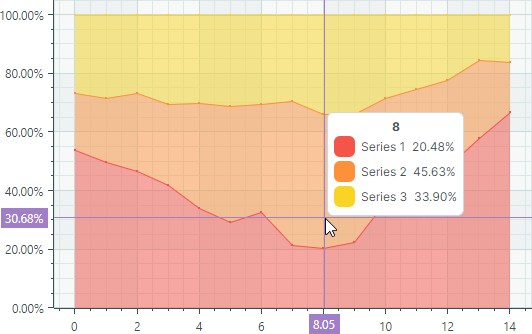
Full-Stacked Area Series View(100% 堆叠面积图)用于显示两个或多个数据系列之间的比例关系。每个 Full-Stacked Area 系列都渲染为堆叠在前一个 Full-Stacked Area 系列之上的填充区域。系列的厚度由其在总量中所占的百分比决定。顶部线条始终对应 100%。
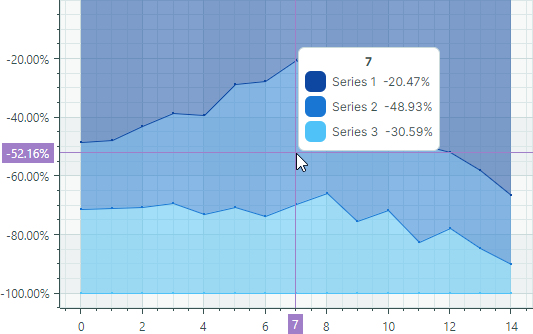
如果图表控件中的所有 Full-Stacked Area 系列都只有负值,则这些系列会沿 Y 轴负方向排列。在这种情况下,底部线条表示 -100%。
- 使用 Full-Stacked Area Series View 可以在同一个图表控件中仅显示正值数据或仅显示负值数据。
- 如果某个 Full-Stacked Area 系列同时包含正值和负值,则所有负值都会被视为零。
Full-Stacked Area Series View 由 CartesianFullStackedAreaSeriesView 类封装。
创建 Full-Stacked Area Series View
通常使用 Full-Stacked Area 视图来显示两个或多个数据系列之间的比例关系。创建 Full-Stacked Area 图表的步骤包括:
- 为每个数据系列创建一个
CartesianSeries对象,并将其添加到CartesianChart.Series集合中。 - 将
CartesianSeries.View属性设置为一个CartesianFullStackedAreaSeriesView对象。 - 使用
CartesianSeries.DataAdapter属性为该系列提供数据。 -
通过自定义 Y 轴的刻度选项,将 Y 轴值格式化为百分比。
在 Full-Stacked Area Series View 中,计算得到的 Y 轴值(及其标签)位于 0 到 1 之间的范围内。要沿 Y 轴以及在十字线标签中将这些值显示为百分比(0%-100%),请将
ScaleOptions.LabelFormatter和ScaleOptions.CrosshairLabelFormatter属性设置为一个PercentLabelFormatter对象(或自定义的IAxisLabelFormatter对象)。参见下面的示例。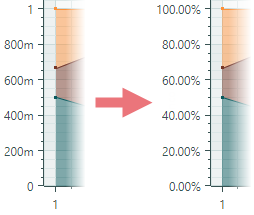
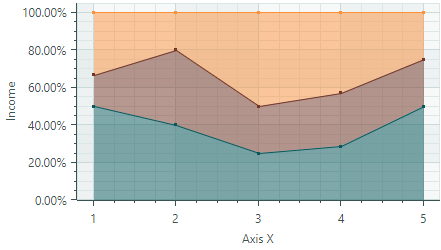
以下代码片段展示了如何用 XAML 和 code-behind 创建由三个数据系列组成的 Full-Stacked Area 图表。
xmlns:mxc="https://schemas.eremexcontrols.net/avalonia/charts"

<mxc:CartesianChart x:Name="chartControl">
    <mxc:CartesianChart.Series>
        <mxc:CartesianSeries Name="areaSeries1" DataAdapter="{Binding DataAdapter1}" >
            <mxc:CartesianFullStackedAreaSeriesView Color="#ff07575b"
                                                Transparency="0.5" MarkerSize="3" ShowMarkers="True"/>
        </mxc:CartesianSeries>
        <mxc:CartesianSeries Name="areaSeries2" DataAdapter="{Binding DataAdapter2}" >
            <mxc:CartesianFullStackedAreaSeriesView Color="#ff763626"
                                                Transparency="0.5" MarkerSize="3" ShowMarkers="True"/>
        </mxc:CartesianSeries>
        <mxc:CartesianSeries Name="areaSeries3" DataAdapter="{Binding DataAdapter3}" >
            <mxc:CartesianFullStackedAreaSeriesView Color="#fffc913a"
                                                Transparency="0.5" MarkerSize="3" ShowMarkers="True"/>
        </mxc:CartesianSeries>
    </mxc:CartesianChart.Series>

    <!--Format Y values as percentage-->
    <mxc:CartesianChart.AxesY>
        <mxc:AxisY ShowTitle="False">
            <mxc:AxisY.ScaleOptions>
                <mxc:NumericScaleOptions>
                    <mxc:NumericScaleOptions.LabelFormatter>
                        <mxc:PercentLabelFormatter />
                    </mxc:NumericScaleOptions.LabelFormatter>
                    <mxc:NumericScaleOptions.CrosshairLabelFormatter>
                        <mxc:PercentLabelFormatter />
                    </mxc:NumericScaleOptions.CrosshairLabelFormatter>
                </mxc:NumericScaleOptions>
            </mxc:AxisY.ScaleOptions>
        </mxc:AxisY>
    </mxc:CartesianChart.AxesY>
</mxc:CartesianChart>
double[] args = new double[] { 1, 2, 3, 4, 5 };
double[] values1 = new double[] { 3, 2, 1, 2, 4 };
double[] values2 = new double[] { 1, 2, 1, 2, 2 };
double[] values3 = new double[] { 2, 1, 2, 3, 2 };

CartesianSeries series1 = new CartesianSeries();
series1.DataAdapter = new SortedNumericDataAdapter(args, values1);
series1.View = new CartesianFullStackedAreaSeriesView()
{
    Color = Color.FromUInt32(0xff07575b),
    Transparency = 0.5,
    ShowMarkers = true,
    MarkerSize = 3
};
CartesianSeries series2 = new CartesianSeries();
series2.DataAdapter = new SortedNumericDataAdapter(args, values2);
series2.View = new CartesianFullStackedAreaSeriesView()
{
    Color = Color.FromUInt32(0xff763626),
    Transparency = 0.5,
    ShowMarkers = true,
    MarkerSize = 3
};
CartesianSeries series3 = new CartesianSeries();
series3.DataAdapter = new SortedNumericDataAdapter(args, values3);
series3.View = new CartesianFullStackedAreaSeriesView()
{
    Color = Color.FromUInt32(0xfffc913a),
    Transparency = 0.5,
    ShowMarkers = true,
    MarkerSize = 3
};

AxisY axisY = new AxisY();
axisY.Title = "Income";
// Format Y values as percentage
axisY.ScaleOptions = new NumericScaleOptions()
{
    LabelFormatter = new PercentLabelFormatter(),
    CrosshairLabelFormatter =  new PercentLabelFormatter()
};
chartControl.AxesY.Add(axisY);

chartControl.Series.Add(series1);
chartControl.Series.Add(series2);
chartControl.Series.Add(series3);
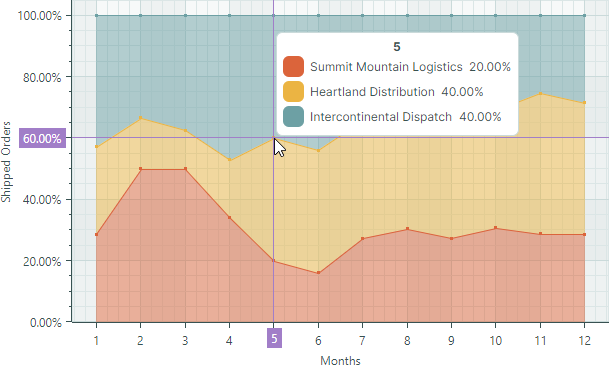
结果如下图所示:
示例 - 使用 MVVM 设计模式创建 Full-Stacked Area 图表
以下示例通过视图模型创建了三个 Full-Stacked Area 类型的系列。
-
CartesianChart.SeriesSource属性绑定到视图模型中的 SeriesCollection 属性。该集合是 SeriesViewModel 对象的数据源,用于初始化图表控件中的各个系列。 -
CartesianChart.SeriesTemplate属性被设置为一个模板,该模板根据每个 SeriesViewModel 对象创建一个 Full-Stacked Area 类型的系列(CartesianSeries对象)。系列数据、标题和颜色分别由 SeriesViewModel.DataAdapter、SeriesViewModel.Title 和 SeriesViewModel.Color 属性确定。 -
ScaleOptions.LabelFormatter和ScaleOptions.CrosshairLabelFormatter属性被设置为一个PercentLabelFormatter对象,以将 Y 轴值格式化为百分比。
<!-- MainWindow.axaml -->
<mx:MxWindow xmlns="https://github.com/avaloniaui"
             xmlns:x="http://schemas.microsoft.com/winfx/2006/xaml"
             xmlns:vm="using:ChartStackedAreaSeriesViewExample.ViewModels"
             xmlns:d="http://schemas.microsoft.com/expression/blend/2008"
             xmlns:mc="http://schemas.openxmlformats.org/markup-compatibility/2006"
             xmlns:mx="https://schemas.eremexcontrols.net/avalonia"
             xmlns:mxc="https://schemas.eremexcontrols.net/avalonia/charts"
             mc:Ignorable="d" d:DesignWidth="800" d:DesignHeight="450"
             x:Class="ChartStackedAreaSeriesViewExample.Views.MainWindow"
             x:DataType="vm:MainWindowViewModel"
             Icon="/Assets/EMXControls.ico"
             Title="ChartStackedAreaSeriesViewExample">
    <Design.DataContext>
        <vm:MainWindowViewModel/>
    </Design.DataContext>
    <Grid ColumnDefinitions="*" Margin="10">

        <mxc:CartesianChart x:Name="chartControl" BorderThickness="0" SeriesSource="{Binding SeriesCollection}" >
            <mxc:CartesianChart.SeriesTemplate>
                <DataTemplate x:DataType="vm:SeriesViewModel">
                    <mxc:CartesianSeries DataAdapter="{Binding DataAdapter}" SeriesName="{Binding Title}">
                        <mxc:CartesianFullStackedAreaSeriesView
                        Color="{Binding Color}"
                        Transparency="0.5"
                        ShowMarkers="True"
                        MarkerSize="3"
                        Thickness="1" />
                    </mxc:CartesianSeries>
                </DataTemplate>
            </mxc:CartesianChart.SeriesTemplate>
            <mxc:CartesianChart.AxesX>
                <mxc:AxisX Name="xAxis" Title="Months" ShowMinorTickmarks="False" >
                    <mxc:AxisX.ScaleOptions>
                        <mxc:NumericScaleOptions GridSpacing="1" LabelFormatter="{Binding ArgsLabelFormatter}" />
                    </mxc:AxisX.ScaleOptions>
                </mxc:AxisX>
            </mxc:CartesianChart.AxesX>
            <mxc:CartesianChart.AxesY>
                <mxc:AxisY Title="Shipped Orders">
                    <mxc:AxisY.ScaleOptions>
                        <mxc:NumericScaleOptions>
                            <mxc:NumericScaleOptions.LabelFormatter>
                                <mxc:PercentLabelFormatter />
                            </mxc:NumericScaleOptions.LabelFormatter>
                            <mxc:NumericScaleOptions.CrosshairLabelFormatter>
                                <mxc:PercentLabelFormatter />
                            </mxc:NumericScaleOptions.CrosshairLabelFormatter>
                        </mxc:NumericScaleOptions>
                    </mxc:AxisY.ScaleOptions>
                </mxc:AxisY>
            </mxc:CartesianChart.AxesY>
            <mxc:CartesianChart.CrosshairOptions>
                <mxc:CrosshairOptions SeriesLabelMode="OneForAllSeries"/>
            </mxc:CartesianChart.CrosshairOptions>
        </mxc:CartesianChart>
    </Grid>
</mx:MxWindow>
// MainWindow.axaml.cs
using ChartStackedAreaSeriesViewExample.ViewModels;
using Eremex.AvaloniaUI.Controls.Common;

namespace ChartStackedAreaSeriesViewExample.Views;

public partial class MainWindow : MxWindow
{
    public MainWindow()
    {
        InitializeComponent();
        this.DataContext = new MainWindowViewModel();
    }
}
// MainWindowViewModel.cs
using Avalonia.Media;
using CommunityToolkit.Mvvm.ComponentModel;
using Eremex.AvaloniaUI.Charts;
using System;
using System.Collections.ObjectModel;

namespace ChartStackedAreaSeriesViewExample.ViewModels;

public partial class MainWindowViewModel : ObservableObject
{
    [ObservableProperty]
    ObservableCollection<SeriesViewModel> seriesCollection = new();

    [ObservableProperty] FuncLabelFormatter argsLabelFormatter = new(o => String.Format("{0:n0}", o));
    public MainWindowViewModel()
    {
        double[] args = new double[] { 1, 2, 3, 4, 5, 6, 7, 8, 9, 10, 11, 12 };
        double[] values1 = new double[] { 10, 15, 20, 18, 10, 8, 12, 14, 15, 20, 17, 20 };
        double[] values2 = new double[] { 10, 5, 5, 10, 20, 20, 17, 15, 20, 25, 27, 30 };
        double[] values3 = new double[] { 15, 10, 15, 25, 20, 22, 15, 17, 20, 20, 15, 20 };

        SeriesCollection.Add(new SeriesViewModel { Title = "Summit Mountain Logistics", Color = Color.FromUInt32(0xFFDB643B), DataAdapter = new SortedNumericDataAdapter(args, values1) });
        SeriesCollection.Add(new SeriesViewModel { Title = "Heartland Distribution", Color = Color.FromUInt32(0xFFEBB443), DataAdapter = new SortedNumericDataAdapter(args, values2) });
        SeriesCollection.Add(new SeriesViewModel { Title = "Intercontinental Dispatch", Color = Color.FromUInt32(0xFF6DA0A4), DataAdapter = new SortedNumericDataAdapter(args, values3) });
    }
}

public partial class SeriesViewModel : ObservableObject
{
    [ObservableProperty] string title;
    [ObservableProperty] Color color;
    [ObservableProperty] ISeriesDataAdapter dataAdapter;
}
Full-Stacked Area Series View 的数据
您可以使用以下数据适配器为 Full-Stacked Area Series View 提供数据:
数值型 X 值:
SortedNumericDataAdapterFormulaDataAdapter
日期时间型 X 值:
SortedDateTimeDataAdapterSortedTimeSpanDataAdapter
定性 X 值:
QualitativeDataAdapter
Full-Stacked Area Series View 设置
Color— 指定用于绘制该系列的颜色。CrosshairMode— 指定十字线的图表标签是捕捉到最近的数据点,还是显示插值结果。参见 在十字线图表标签中显示精确值或插值。-
MarkerImage— 获取或设置用作自定义点标记的图像。如果未指定图像,则显示默认的方形标记。您可以使用SvgImage类实例来指定 SVG 图像。MarkerImage属性使用[Content]特性声明,这使您可以直接在 <CartesianFullStackedAreaSeriesView> 标签之间定义图像。<mxc:CartesianFullStackedAreaSeriesView> <SvgImage Source="avares://Demo/Assets/circle.svg" /> </mxc:CartesianFullStackedAreaSeriesView>SVG 文件包含 SVG 元素的预定义颜色。要使这些颜色与您的数据系列颜色相匹配,您可以:
- 提前手动编辑源 SVG 图像文件
- 使用
MarkerImageCss属性动态自定义 SVG 元素的样式。这些样式会在渲染点标记时应用。
-
MarkerImageCss— 指定用于在运行时自定义由MarkerImage属性定义的 SVG 图像的 CSS 样式。主要用途是将 SVG 元素的颜色替换为系列颜色(Color)。在 CSS 代码中包含{0}占位符,以插入Color属性的值。例如,当
MarkerImage属性包含带有 circle 元素的 SVG 图像时,以下 CSS 代码会将circle样式设置为橙色填充(使用系列颜色)和深红色边框: -
MarkerSize— 指定点标记的大小。 ShowInCrosshair— 指定当前系列的十字线图表标签的可见性。参见 自定义十字线的图表标签。ShowMarkers— 启用或禁用点标记。Thickness— 指定线条的粗细。Transparency— 一个介于0和1之间的值,指定填充区域的透明度级别:0表示完全不透明1表示完全透明
* 本页面使用机器翻译技术翻译。