Range Area Series View
Range Area Series View(CartesianRangeAreaSeriesView)绘制两条线,并填充这两条线之间的区域。
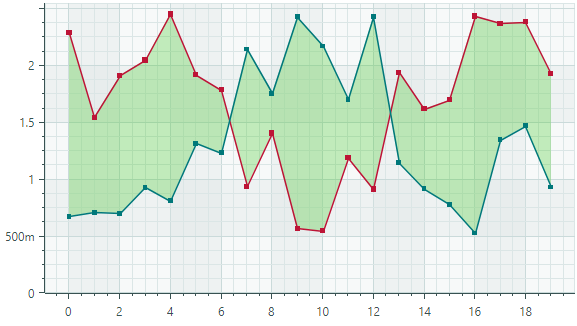
您需要为每个数据点提供两个 Y 值。这些值定义了范围的下限和上限。图表用线条连接每个边界的 Y 值,并用指定的颜色填充它们之间的区域。
创建 Range Series View
要创建 Range Series View,请将一个 CartesianSeries 对象添加到 CartesianChart.Series 集合中,并使用一个 CartesianRangeAreaSeriesView 实例初始化 CartesianSeries.View。
使用 CartesianSeries.DataAdapter 属性为该系列提供数据。Range Area Series View 要求每个数据点提供两个 Y 值。您应使用专门的数据适配器为 Range Area Series View 提供 Y 值。有关支持的数据适配器信息,请参阅以下链接:Range Area Series View 的数据。
CartesianRangeAreaSeriesView 对象包含 Color1、Color2 和 Color 属性,允许您为线条和填充区域指定不同的颜色。
以下代码展示了如何在 XAML 和 code-behind 中创建 Range Area Series View。
<mxc:CartesianChart x:Name="chartControl">
    <mxc:CartesianChart.Series>
        <mxc:CartesianSeries Name="rangeAreaSeries1" DataAdapter="{Binding DataAdapter}" >
            <mxc:CartesianRangeAreaSeriesView Color="Red"
                                                Color1="Green"
                                                Color2="Blue"
                                                Transparency="0.4"/>
        </mxc:CartesianSeries>
    </mxc:CartesianChart.Series>
</mxc:CartesianChart>
CartesianSeries series = new CartesianSeries();
chartControl.Series.Add(series);
List<double> args = new() { 1, 2, 3, 4, 5 };
List<double> values1 = new() { -1, 5, 3, 7, 4 };
List<double> values2 = new() { 5, 1, 6, 2, 3 };
series.DataAdapter = new NumericRangeDataAdapter(args, values1, values2);
series.View = new CartesianRangeAreaSeriesView()
{
    Color = Avalonia.Media.Colors.Red,
    Transparency = 0.4,
    Color1 = Avalonia.Media.Colors.Green,
    Color2 = Avalonia.Media.Colors.Blue
};
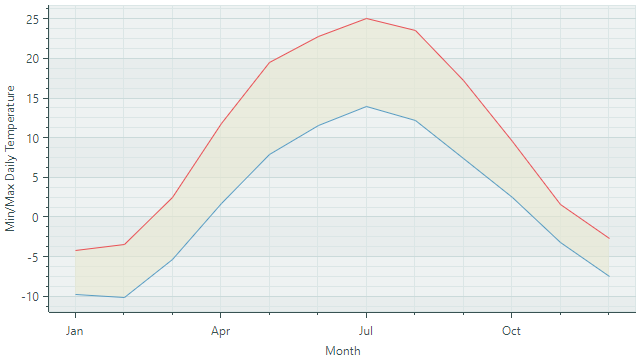
示例 - 使用 Range Area Series View 显示月度最低和最高气温
以下示例使用 Range Area Series View 显示某城市每月的最低和最高气温。数据适配器(DateTimeRangeDataAdapter)为每个数据点(月份)提供两个 Y 值。
请注意此处使用 DateTimeScaleOptions.LabelFormatter 属性以自定义方式格式化 X 轴的标签。
<mx:MxWindow xmlns="https://github.com/avaloniaui"
        xmlns:x="http://schemas.microsoft.com/winfx/2006/xaml"
        xmlns:vm="using:ChartRangeAreaSeriesView.ViewModels"
        xmlns:d="http://schemas.microsoft.com/expression/blend/2008"
        xmlns:mc="http://schemas.openxmlformats.org/markup-compatibility/2006"
        xmlns:mx="https://schemas.eremexcontrols.net/avalonia"
        xmlns:mxc="https://schemas.eremexcontrols.net/avalonia/charts"
        mc:Ignorable="d" d:DesignWidth="800" d:DesignHeight="450"
        x:Class="ChartRangeAreaSeriesView.Views.MainWindow"
        x:DataType="vm:MainWindowViewModel"
        Icon="/Assets/EMXControls.ico"
        Title="ChartRangeAreaSeriesView">

    <Design.DataContext>
        <vm:MainWindowViewModel/>
    </Design.DataContext>

    <mxc:CartesianChart x:Name="chartControl">
        <mxc:CartesianChart.Series>
            <mxc:CartesianSeries Name="rangeAreaSeries1" DataAdapter="{Binding RangeAreaSeries1.DataAdapter}" >
                <mxc:CartesianRangeAreaSeriesView Color="{Binding RangeAreaSeries1.Color}"
                                                  Color1="{Binding RangeAreaSeries1.Color1}"
                                                  Color2="{Binding RangeAreaSeries1.Color2}"
                                                  Transparency="0.6"/>
            </mxc:CartesianSeries>
        </mxc:CartesianChart.Series>
        <mxc:CartesianChart.AxesX>
            <mxc:AxisX Name="xAxis" Title="Month" >
                <mxc:AxisX.ScaleOptions>
                    <mxc:DateTimeScaleOptions LabelFormatter="{Binding MonthFormatter}"
                                              MeasureUnit="Month"/>
                </mxc:AxisX.ScaleOptions>
            </mxc:AxisX>
        </mxc:CartesianChart.AxesX>
        <mxc:CartesianChart.AxesY>
            <mxc:AxisY Title="Min/Max Daily Temperature"/>
        </mxc:CartesianChart.AxesY>
    </mxc:CartesianChart>
</mx:MxWindow>
using CommunityToolkit.Mvvm.ComponentModel;
using Avalonia.Media;
using Eremex.AvaloniaUI.Charts;
using System;
using System.Collections.Generic;

namespace ChartRangeAreaSeriesView.ViewModels;

public partial class MainWindowViewModel : ViewModelBase
{

    [ObservableProperty] FuncLabelFormatter monthFormatter = new(o => String.Format("{0:MMM}", o));
    [ObservableProperty] SeriesViewModel rangeAreaSeries1;

    public MainWindowViewModel()
    {
        RangeAreaSeries1 = new()
        {
            Color = Color.FromUInt32(0xffE7E8D1),
            Color1 = Color.FromUInt32(0xffe95057),
            Color2 = Color.FromUInt32(0xff589cc1),
        };
        List<double> values1 = new() { -4.2, -3.4, 2.5, 11.9, 19.6, 22.8, 25.1, 23.6, 17.3, 9.6, 1.6, -2.7 };
        List<double> values2 = new() { -9.7, -10.1, -5.3, 1.8, 7.9, 11.6, 14.0, 12.2, 7.4, 2.5, -3.1, -7.5 };
        List<DateTime> args = new();
        for (int i = 1; i <=12; i++)
            args.Add(new DateTime(DateTime.Now.Year, i, 1));
        rangeAreaSeries1.DataAdapter = new DateTimeRangeDataAdapter(args, values1, values2);
    }
}

public partial class SeriesViewModel : ObservableObject
{
    [ObservableProperty] Color color;
    [ObservableProperty] Color color1;
    [ObservableProperty] Color color2;
    [ObservableProperty] DateTimeRangeDataAdapter dataAdapter;
}
Range Area Series View 的数据
您可以使用以下数据适配器为 Range Area Series View 提供数据。这些数据适配器允许您为每个参数指定两个 Y 值。
数值型 X 值:
NumericRangeDataAdapter
日期时间型 X 值:
DateTimeRangeDataAdapterTimeSpanRangeDataAdapter
定性 X 值:
QualitativeRangeDataAdapter
Range Area Series View 设置
Color— 指定用于填充两条线之间区域的颜色。使用Transparency选项控制填充区域的透明度级别。Color1— 指定用于绘制第一条线的颜色。Color2— 指定用于绘制第二条线的颜色。CrosshairMode— 指定十字线的图表标签是捕捉到最近的数据点,还是显示插值结果。参见 在十字线图表标签中显示精确值或插值。Marker1Image— 允许您指定用作第一条线点标记的 SVG 格式图像。Marker1ImageCss— 指定 CSS 代码,用于自定义指定 SVG 图像(Marker1Image)中元素的颜色。Marker1Size— 指定第一条线的点标记大小。Marker2Image— 允许您指定用作第二条线点标记的 SVG 格式图像。Marker2ImageCss— 指定 CSS 代码,用于自定义指定 SVG 图像(Marker2Image)中元素的颜色。Marker2Size— 指定第二条线的点标记大小。ShowInCrosshair— 指定当前系列的十字线图表标签的可见性。参见 自定义十字线的图表标签。ShowMarkers1— 启用或禁用第一条线的点标记。ShowMarkers2— 启用或禁用第二条线的点标记。Thickness1— 指定第一条线的粗细。Thickness2— 指定第二条线的粗细。Transparency— 获取或设置填充区域的透明度级别,取值范围为0(完全透明)到1(完全不透明)。
* 本页面使用机器翻译技术翻译。